05 May 2021
A New View of Reversed Phase HPLC Selectivity
By Tony Taylor - Chief Scientific Officer
Earlier this year, myself and a group of collaborators published an update of the Hydrophobic Subtraction Model (HSM) for HPLC selectivity [1,2]. To cut a long story short, over the 17 years since the original HSM was published, those who curate the model have collected a huge amount of data as new HPLC stationary phases have been added. Analysis of this new data, on almost 600 stationary phases, has allowed us to update or adjust several of the stationary phase/analyte interaction terms within the model as well as adding one entirely new term to better describe the dipolar interactions with more modern stationary phases such as the pentafluoro phenyl type phases. The updated model with a brief description of the important selectivity parameters is shown in Equation 1;

- hH – solute / stationary phase hydrophobic interaction
- bA - solute / stationary phase interaction based on solute hydrogen bond basicity
- a0B – solute / stationary phase interaction based on solute hydrogen bond acidity
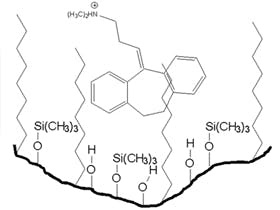
- kC - solute / stationary phase interaction based on solute cation exchange propensity (protonated bases at pH 2.8)
- vV - solute / stationary phase interaction based on solute size
- dD - solute / stationary phase interaction based on solute dipolarity
Both the original and updated models use a set of 16 chemical test probes (Figure1), selected because their chemical and physicochemical properties are able to highlight specific facets of both retention and selectivity of the stationary phase. Using the updated model, we have been able to simulate the resulting ‘chromatograms’ for these test mixtures in order to enable a visual comparison of the selectivity differences between phases. Within the Arch Sciences Group we typically use the model to compare the selectivity of stationary phases to find alternatives, optimise the selectivity of phases for specific applications and to select columns for new method development.

Figure 1: Test probes used to examine stationary phase selectivity in the new and updated Hydrophobic Subtraction Model of reversed phase HPLC selectivity
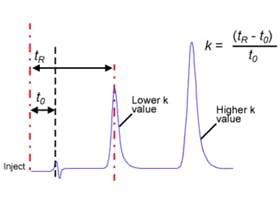
The HSM approach to compasion of stationary phase selectivity has been widely used in industry since it’s inception, however, I tend to find that the comparisons between columns, which are based on the numerical values of each term within the equation or a reductive measure based on statistical similarity (the so-called Fs or Similarity number) do not ‘speak’ to my chromatography mindset as directrly as I would like. Using the relative retention factor of each of the test probes to that of ethylbenzene, it is possible to use the published values of the terms of the equation to recreate a plot of retention factor for each of the test probes. This is helpful as, given that all measurements are made against a single probe on a single phase, the resulting plots resemble the type of chromatograpgic output that we can relate to our daily practice. The power of this approach is the ability to simulate the selectivity behaviour of a huge number of stationary phase types for visual comparsion and to draw broad conclusions on the chemsitry and selectivity of the phases based on the separation of the various test probes. As I mentioned above, these probes are selected for their ability to highlight specific aspects of the analyte / stationary phase interaction, and as such we can begin to understand the separating power of each stationary phase for particular applications. Whilst we have been able to codify and to some extent to quantify these relative measurements, what I’m considering here are the broad conclusions that can be made ‘eyeball-o-mertrically’, which whilst not highly scientific rigorous, can be highly informative of the predimoninant interactions of the stationary phase which will help to drive the selectivity we desire in HPLC.
To illustrate the power of this new approach, I’ve selected some examples with brief explanations of conclusions which may be drawn from them. I chose a variety of stationary phases from a well regarded manufacturer to explore if the model can highlight the supposed differences between the phases, as per our common undertanding of the relative strengths and weaknesses of each phase type. As all phases are from a single manufacturer in the first example set, one can make a broad assumption that the effects of differences in the type or treatment of the base silica will be somewhat minimised and, for this simple comparison, we will be able to evalute on the differences in the separation caused by the changing chemistry of the bonded phase ligand or the degree of access that a solute may have to the silica surface as the ligand type changes. This latter point is important as several of the terms within the selectivity model are related to the possible interactions of the analyte with the base silica, rather than the chemically bonded ligand (C18, C8, CN etc.). It is worthy of note that all test probe measurements are made using isocratic elution with an eluent composition of 50/50 ACN/60 mM potassium phosphate, pH 2.8, with a column temperature of 35 °C.

Figure 2: Retention factor versus normalised response for the test probes of Figure 1 on a C18 and C8 column form a well regarded HPLC stationary phase manufacturer
As can seen from Figure 2, the output from the visualisation looks ‘chromatographic’ and the retlative retention factor of each analyte can be easily compared, with ‘tie lines’ between the analytes to track them between the two comparative figures. The importance of this approach will become obvious in later figures! Whilst a detailed analysis of the various conclusions from each figure is beyond the scope of this short discussion, it’s worth highlighting some general features for each of the comparisons.
The retention order of the solutes on the C18 and C8 column are broadly correlated with analyte hydrophobicity (LogP or LogD) and we will use the C8 phase in each case as the basis on which to draw our conclusions of relative retention and therefore selectivity. It is interesting to note that the cis- and trans-chalcone solutes, whose only difference is their apparent ‘volume’ in solution (one is planar and the other has free rotation about a central bond) are well retained and separated on most C18 columns.
The C8 phase shows a different selectivity in the latter part of the chromatogram as the retention of ethyl benzene decreases and the ability of the C8 phase to discriminate between the chalcones also slightly diminishes. Other than these changes, the C8 chromatogram produces a reasonably good reproduction of the C18 phase, but in a shorter timescale, and this is broadly true for all C18 and C8 phases from every manufacturer. It often makes me wonder why we don’t select C8 phases more often for method development as effectively we will get very similar results in a shoter time frame. In this particular example one will note that the separation between 5,5-diphenylhydantoin (DPH), and p-nitrophenol (PNP), is better on the C8 column and from extensive use of the database, it is clear that this separation is very difficult using the phases which are predominantly driven by hydrophobic interactions (C18, C8 etc.).


Figure 3: Retention factor versus normalised response for the test probes of Figure 1 on a C8 and Phenyl Hexyl phase (Top) and the same C8 and a Biphenyl phase (Bottom) all the from same manufacturer
Figure 3 highlights the differences in selectivity as we switch to Phenyl based phases which have more dominant cation exchange and dipole interaction terms (Figure 4).


Figure 4: Comparison of the magnitude of each term in Equation 1 from the C18 column (blue) and a phenyl based phase (orange) for a phenyl-hexyl phase (left) and a biphenyl phase (right)
Whilst the effects are more subtle, those analytes containing strong dipole moments (D) such as benzonitrile will be affected to a greater extent and thus the actetophenone / benzonitrile ion pair show improved selectivity. Similarly, where analytes have extensive aromatic character such as amitriptyline and nortriptyline, selectivity is also enhanced with the phenyl phases. This peak pair shows further selectivity improvement when using the biphenyl phase. Phenyl-hexyl and biphenyl phases also show an enhanced cation exchange (C) capacity, which is reflected in a large relative loss of retention in ethylbenzene and mefenamic acid. One should note that the modifier used in the characterisation studies is acetonitrile and larger selectivity changes for aromatic and dipolar analytes would be seen if methanol was used as the modifier.

Figure 5: Comparison of the separation selectivity of the test probes from Figure 1 using a C8 and cyano stationary phase with accompanying information of the magnitude on the terms in the updated HSM model in the lower figure
Cyano phases also show an enhanced dipole moment separation, which is highlighted with a slight improvement in the selectivity between acetophenone and benzonitrile and the improvement in retention of nortriptyline and amitriptyline. However, one can also see from the simulated retention factor chart that the main disadvantage of the cyano phases is the low overall retention of the phase. For this reason, the phenyl and pentafluoro phases have overtaken cyano phases in terms of their popularity.

Figure 6: Comparison of the separation selectivity of the test probes from Figure 1 using a C8 and pentafluorophenyl (PFP) stationary phase with accompanying information on the magnitude of the terms in the updated HSM model in the lower figure
Figure 6 shows why pentafluoropropyl phases have become so popular in recent times. The very high dipole and cation exchange characteristics of the phase produce a very dramatic increase in the retention and selectivity of the nortriptyline and amitriptyline peak pair. The electron dense p systems within the aromatic rings of the stationary phase can also participate in non-covalent interactions with protonated amine groups. The PFP phases are particularly popular in the pharmaceutical industry due to their ability to discriminate between subtle functional group changes on central aromatic scaffolds, which is the case for many physiologically active small molecules. The selectivity change between anisole and 5-phenylpentanol is also interesting and is the result of a larger reduction in retention for the later analyte relative to the former, probably as a result of the activated nature of the aromatic ring within the anisole structure (Ar-O). Again, due to the general reduction in the hydrophobic nature of the surface ligands, the reduction in retention of the later eluting analytes (ethylbenzene, mefenamic acid and the chalcones) is seen with the PFP phase, although it should be noted that of all of the less hydrophobic ligands, the PFP shows the lowest degree of overall retention loss compared to the C8 phase.

Figure 7: Comparison of the separation selectivity of the test probes from Figure 1 using a C8 and an embedded polar amide stationary phase with accompanying information on the magnitude of the terms in the updated HSM model in the lower figure
Figure 7 shows the power of the so called polar embedded phases, in this case the hydrophobic bonded ligand has a amide group within the alkly chain, to facilitate retention of acidic analytes and to shield the surface charge of the base silica. It is clear that both the mefanamic and butyl benzoic acids are retained much more effectively compared to the C8 phase and this feature is used extensively in industry to alter the selectivity of acidic species relative to neutral or basic analytes. One unusual feature of the simulated separations is the increased retention of para-nitrophenol relative to the 5,5-diphenylhydantoin, which is a challenging separation on many of the other stationary phases. It should be understood that the amide embedded functional group is able to hydrogen bond with any analyte which can be a hydrogen bond donor, and this includes amides and hydroxyl groups, which may explain the increased retention of the para-nitrophenol (which is charged in aqueous solution), relative to the 5,5 diphenyl hydantoin.
Whilst these visual comparisons are very interesting between phases from the same manufacturer, we should be careful in drawing firm conclusions. One of the other powerful aspects of the visualtion model, is the comparison of the same stationary phase comparison between different manufacturers. In figure 8, each of the phases above are compared to that of other manufacturers, again all from well regarded companies.


Figure 8: Comparison of the relative selectivity of various phases from the manufacturer used in figures 2 through 7 to phases of the same chemistry from alternative manufacturers
It is quite clear from Figure 8 that there is a very large amount of variation between phases, even of the same nominal chemistry, and as such we need to be careful when drawing conclusions from the measurements from a single manufacturer. The visualisation method associated with the new HSM model is an important tool in understanding these differences and in the identification of similar and orthgonol stationary phase in a database of almost 600 phases.
Featured products

Related articles