09 Jun 2020
GC Diagnostic Skills III | Baseline Problems
In Gas Chromatography (GC), perhaps more than any other technique, our technical department get asked to help diagnose and fix problems with baselines. Also, again particularly for GC, the mode of the baseline disturbance and the underlying causes can take many forms, and it’s worthwhile spending a little time to distinguish between them and to come up with some rules of thumb for efficiently tackling the problems.
Here we will break down the many forms of GC baselines problems into the following categories;
- Baseline drift
- Baseline noise
- Baseline disturbances – extra peaks, homologous series and baseline spikes
- Baseline humps
Each of these problems present several possible causes and in keeping with the spirit of this series, we look to prioritise troubleshooting actions in order to enable the most efficient diagnosis of the issue and some suggestions for how to remedy the problem.
Baseline Drift
 versus the normal chromatogram (blue).")
Figure 1: GC chromatogram showing baseline drift (red) versus the normal chromatogram (blue).
Figure 1 shows a typical example of baseline drift overlaid with a previous ‘good’ chromatogram and represents the typical increase in baseline position over time which we associate with classical baseline drift. Most GC users will typically think of ‘column bleed’ as the underlying cause of such drift, but as well see later, this is much less likely than other causes, especially if the GC column has been properly equilibrated.
The more common cause of this type of drift is a change in detector response over the course of thr analysis. This might be caused when, for example, the carrier gas flow is operated in constant pressure rather than constant flow mode during a gradient temperature program. In constant pressure mode, as the oven temperature rises, the carrier gas velocity decreases due to increases in carrier gas viscosity under constant pressure conditions. Many common GC detectors, including the FID detector, are mass-flow sensitive and hence, as the carrier gas flow rate decreases the detector response changes in accordance with the increasing oven temperature. Modern GC instruments offer the option of operating in Constant Flow mode, in which the carrier gas pressure is ramped in line with the oven temperature program to ensure that the carrier gas flow rate into the detector is constant during the analytical method, hence maintaining a constant detector background response.
It should be noted that this baseline shift is typically accompanied by an increase in retention time of analyte peaks and/or peak broadening of later eluting peaks, which are not seen in Figure 1 – so what could be the problem? Actually, the problem in this chromatogram was created due to an overall reduction in FID make-up gas flow rate during the run, due to the incorrect programming of a make-up gas flow program. Some modern GC instruments offer the option of ramping the make-up flow to simulate constant flow operation even when operating in constant pressure mode.
Although this latter problem is much less common, it does remind us that we need to check ALL gas flows into the detector when troubleshooting baseline drift issues, to determine the cause of the problem. This often means setting each individual detector gas flow and reducing all others to zero, prior to measuring the flow from the detector using a digital gas flow meter.
So, how do we rule out the baseline drift issue being associated with GC column bleed? The stationary phase used in capillary columns will be a cured and chemically immobilised liquid polymeric material based on either a polysiloxane or a polyol. In the case of the polysiloxane based phase, the presence of oxygen catalyses the cleavage of backbone siloxane units via a ‘back biting’ reaction as shown in Figure 2. Whilst this reaction is catalysed at higher temperature, it also occurs at room temperature.

Figure 2: Reaction scheme for formation of cyclic polysiloxane bleed products from a dimethyl polysiloxane immobilised GC stationary phase.
The cyclic siloxanes formed are volatile, and elute from the column as bleed, which manifests itself as a rising baseline. It is important to note that ‘true’ column bleed, which is a constant feature of all siloxane-based GC phases, and almost never results in discrete peaks on the baseline. We will revisit this topic later.
A classic stationary phase profile with increasing temperature is shown in Figure 3.

Figure 3: Typical capillary GC stationary phase bleed profile for two different polysiloxane based stationary phases (Figure reproduced with permission, Agilent Technologies, Santa Clara, Ca, USA). Inset shows how relative phase bleed can be made at different oven temperatures.
Column bleed profiles are typically measured at two or three oven temperatures as shown in the inset in Figure 3. The relative column bleed is measured using the detector response at each temperature and this exercise should be undertaken when the column is first used, to save as a reference of column bleed for that particular column. Care should be taken never to exceed the manufacturers isothermal maximum temperature recommendation for the column.
However, any assessment of column bleed should only be made once the column has been properly thermally equilibrated, and the following recommendations on column equilibration should also be followed.
Most users will typically install the GC column, increase the oven temperature and leave at a high temperature for a protracted period of time to burn off any oxidation products prior to reducing the oven temperature and starting their analyses. This approach if flawed in several respects, including;
1) Any dissolved oxygen in the phase has not been purged and therefore further phase oxidation will occur as soon as the oven temperature is increased
2) The flow rate of the column needs to be optimised for the thermal equilibration
3) The time required for phase equilibration at the upper temperature limit is much shorter than most users realise.
For full details on how a GC stationary phase should be properly equilibrated, have a look at GC column conditioning
Point 1 above is perhaps the most important, and calls for the carrier gas to flow through the column for a set period of time (or number of column volumes at a particular flow rate), at room temperature. This allows the phase to be purged of oxygen and users will typically find that if this step is followed, actual thermal equilibration times are vastly reduced.
6 column volumes are usually recommended as a minimum requirement for carrier flow at room temperature when the column is installed, and a single column volume can be calculated using the following relationship;
1 column volume = L(mm) x(id/2)2 x π
For a 30m x 0.25mm column;
Column volume = 30,000 x (0.25/2)2 x π
Column volume = 1.472 mL
Therefore 6 column volumes = 1.472 x 6 = 8.84 mL
or 8.84 mins. at a carrier flow of 1.0 mL/min.
In summary, for baseline drift problems, take the following troubleshooting approaches (in order);
- Constant pressure versus constant flow carrier gas flow settings
- Check detector gas flows independently using a digital gas flow meter
- Verify column bleed profile against bleed profile generated when the column was new and properly equilibrate GC column where necessary
Baseline Noise
 versus the normal chromatogram (blue).")
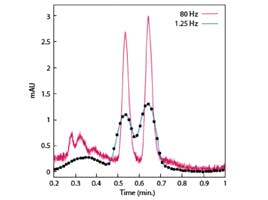
Figure 4: GC chromatogram showing increased baseline noise (red) versus the normal chromatogram (blue).
Figure 4 shows a typical noisy GC baseline signal compared to a signal with an acceptable level of noise. Visually, one can recognise the higher level of random baseline variation in the upper signal compared to the lower, and this noise can be measured using several standardised approaches, but typically the Peak to Peak variation in baseline signal is measured at the maximum baseline deflection points over a set period of time.
Before starting any troubleshooting activities, one must ensure that the data system level of magnification is appropriate to assess the noise (every signal is noisy when the level of zoom is maximised!) and that the detector attenuation (if available) has been set correctly.
Once the baseline noise has been confirmed, there are several different approaches to identifying the problem, however, once the column has been properly equilibrated, then the problem is almost invariably detector related.
Here is our step by step guide to identifying and eliminating higher frequency, random noise issues as shown in Figure 4;
- Check and verify detector attenuation settings
- Ensure that the column has been properly installed in the detector, especially with ionising detectors, incorrect column installation can lead to very pronounced noise issues. The position of the column end within the detector body needs to be carefully controlled and manufacturers installation guidelines need to be followed closely
- Ensure that the GC inlet and detector connections are leak free
- Ensure that the GC column is properly thermally equilibrated (see previous section)
- Ensure that all detector gas supplies (especially the fuel gas) are set correctly and that the supply is consistent (measure each gas flow independently using a digital flow meter)
- If the detector has recently been maintained, ensure that the detector components have been correctly re-assembled (again seek manufacturers advice if you are in doubt)
- Check the electrometer or amplifier for excess noise (contact your manufacturer if you are unsure how to do this)
Point 5 in the list is particularly important and incorrect or irreproducible gas supply flows are frequently the cause of noise within GC chromatograms, especially when using using gas generators to supply the detector gases. Point 6 is obviously more important post detector maintenance and several detector types require that insulator components are correctly installed in order to generate a noise free signal. One needs to carefully follow manufacturers guidelines when rebuilding the detector – especially regarding the positioning of insulating components. Point 7 refers to the issues related to ‘electronic noise’ within the system and, as most GC detectors are connected to an amplifier of some kind, it is important to check the positioning of, or connection to, the amplifier. Of course, these electronic components may be expected to fail at some point, and typically this will require a visit from your support engineer to diagnose the viability of the amplifier and associated circuitry.
Baseline disturbances – extra peaks, baseline spikes
 versus the normal chromatogram (red).")
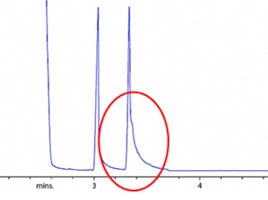
Figure 5: GC chromatogram showing baseline disturbances with late eluting ‘discrete’ peaks (blue) versus the normal chromatogram (red).
Figure 5 shows the first in a series of issues which we call ‘Baseline Disturbances’ and in this example we can see the issues with some later eluting discrete peaks on the baseline.
I could predict, once again, that many end users would attribute these issues to column bleed, but in this case, this attribution would be incorrect. As previously explained, column bleed is much more likely to give a gradual baseline rise or, as we will see shortly, as series of homologous peaks. Discrete peaks as shown in Figure 5 are much more likely to arise from other causes and the following list treats each of those causes in order of likelihood;
1) Highly retained components eluting from the GC column – strongly absorbed matrix components (or indeed analytes of interest) may elute late in the chromatogram or may be migrating down the column and eluting several injections later (look for unusually broad peaks to confirm this). Try trimming the column (0.5-1m) at the inlet end and re-examine the chromatogram. Ensure that there is a high temperature burn at the gradient temperature maximum at the end of the gradient and hold there to be sure that all strongly retained components have been eluted.
2) Consider more selective sample preparation or pre-treatment to reduce the number and amounts of matrix components being introduced to the inlet and GC column.
3) Ensure that gloves are worn during column installation for both inlet and detector installation and wipe the column ends with a solvent (hexane works well) to remove any contaminants prior to installation. In fact, the issue in Figure 5 is the elution of contaminants deposited onto the out column surface by the users hands during column cutting and installation
4) Use a fresh liner and consider inlet maintenance (replacement of seals, ferrules or o-rings) and re-assess. In many cases, contaminants build up in the inlet and elute slowly into the GC column, especially when using splitless injection

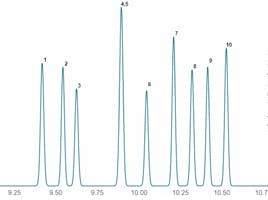
Figure 6: GC chromatogram showing baseline disturbance of regularly spaced later eluting peaks and underlying baseline ‘hump’.
Figure 6 shows another chromatogram with late eluting peaks and, on the face of it, the symptoms may look very similar to those in Figure 5. However, a closer look at the chromatogram will reveal that the peaks look like they may belong to a series of components, the baselines variations being very reproducible. This suggests that the analytes / contaminants elute in a regular series and that they may belong to a homologous series of some sort. This would point us towards a few specific problems as we outline below (again in order in which they should be investigated);
1) The polysiloxane by-products of stationary phase decomposition sometimes form series of homologues – properly thermally equilibrate the stationary phase and repeat the experiment
2) If thermal equilibration does not fix the problem, consider trimming in the inlet end of the column by up to 1m, thermally equilibrate the column and repeat the experiment
3) Reposition the column in the detector and repeat the experiment
Septum bleed products often form homologous series typical of those shown in Figure 6 – check the septum for coring and inspect the liner for shards of septum and remove as appropriate. The septum should be renewed inf any evidence of coring is present. The injection needle should be inspected for burs, this may be the cause of the septum coring, check also that the septum is not held under too high a torque by adjusting the septum night tightening as appropriate. The septum purge flow is designed to sweep away the thermal decomposition products from the septum and prevent these contaminants from entering the GC inlet. Check that the septum purge flow rate is correct and verify using a digital flow meter

Figure 7: GC chromatogram showing baseline spikes, that is, peaks randomly interspersed within the chromatogram which sometimes have gaussian shape and at other times with have no peak width even on high data system magnification.
Figure 7 shows a baseline with a typical ‘spiking ‘ behaviour. It should be noted that these spikes may have a discernible ‘peak width’ when examined under high data system magnification or they may have no gaussian width at all, that is , they are discrete lines with no width. It is important to differentiate between these two types of spiking, as they point to different causes.
Spikes with discernible peak width and gaussian shape are almost always the result of polyimide flakes from the end of the column being introduced into the flame of an ionising detector. If the column is installed too high into the very high temperature region on an ionising detector (not MS), then the polyimide coating on the outside of the column will bake and become brittle, ultimately shedding chips or flakes of polyimide into the detector, which give rise to these ‘spikes’. One should re-position the column within the detector according to manufacturer’s guidelines.
If the spikes have no gaussian peak width, then the cause is likely to be electrical. These spikes can be caused by poor shielding of the instrument from fluctuations in supply, by electrical shorting or surges from the detector amplifier or from a circuit board drawing irregular amounts of current as it nears the end of its useful lifetime.
If the detector has recently been maintained and re-built, disassemble and re-assemble it according to manufacturers instructions, taking care that the connection to the amplifier is properly made or connected. One might also consider connecting a power scrubber or smoothing unit between the bench supply and the GC instrument to provide surge protection. Beyond these two measures, it is typically a service provider fix to trace and remedy any electrical problems within the instrument circuitry.
Baseline Humps

Figure 8: GC chromatogram showing broad baseline disturbances also known as a baseline ‘hump’.
Figure 8 shows what may typically be described as a baseline ‘hump’ and this again is a fairly typical presentation that we are frequently asked to help with. Sometimes this is a real ‘problem’ whilst at other times it is a facet of the samples under analysis and the trick is to identify which of these applies in your situation.
If the chromatogram previously obtained for sample analysis shows no broad baseline disturbance or ‘hump’ as we have described it, then the issue may well lie with one of the other causes that we have described above. Most likely, there will be a range of chemically related, highly absorbed components eluting from a previous injection (not necessarily the proceeding one) and one should investigate by carrying out further injections to see if the issue is repeatable in every injection or the problem occurs in, say, every 2nd or 5th injection. If this is the case, then this suggests the strong retention of matrix components and the temperature program end point should be raised to within acceptable limits and a lengthy high temperature ‘burn’ period added to remove these components.
If this does not cure the problem, then removal of an appreciable length (>1m) of column from the inlet end, should also be considered followed by proper thermal equilibration of the column.
In some circumstances however, the hump is merely the close elution of an underlying homologous series of peaks and is typical when analysis, for example, petrochemicals or substances of a waxy nature. Figure 8 demonstrates an example, in which the chromatogram of the reference standard appears quite normal whilst the sample chromatogram, containing the sample matrix, shows the broad baseline disturbance. This is further investigated using a placebo of the sample matrix, which again shows the disturbance. If it is not possible to improve the sample preparation by selective extraction of the desired analyte components, then an integration algorithm may need to be developed which targets either ‘whole group’ analysis or attempts to integrate each analyte through a tangent skimming approach, where each analyte peak is integrated without taking into account the underlying baseline increase. In the latter case, it is important to matrix match the standard solutions, otherwise highly imprecise quantitative data might result.
As with all chromatography troubleshooting, GC baselines issues can have several underlying causes and it is important to first assess which type of baseline issue is occurring. Once this is established, one can then prioritise the troubleshooting to most efficiently identify and eliminate the problem. I frequently see the GC column being blamed for a myriad of GC baseline issues, and very often this isn’t the true underlying cause and, as such, I hope this guide offers some insight into how to first diagnose the baseline problem and then treat the possible causes in their priority order.
If you missed them why not check out the first two instalments in this series:
GC Diagnostic Skills I | Peak Tailing
and
GC Diagnostic Skills II | Reduced Peak Size