08 Sep 2020
GC Diagnostic Skills IV | Selectivity & Resolution Changes
This instalment in our gas chromatogram troubleshooting series focuses on unexpected changes to selectivity and, therefore, resolution within our chromatographic data output.
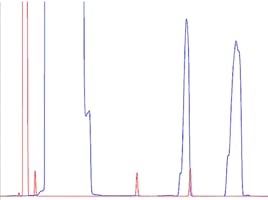
Figure 1 shows the separation of some key components in a pesticide mix. The instrument conditions are shown alongside the ‘ideal’ chromatogram which, as you will note, is actually far from ideal, given that there is a perfectly co-eluting peak pair.

Figure 1: Reference GC separation of some closely eluting pesticide components on a 5% phenyl 95% polydimethyl siloxane GC column. Other conditions and solutes as shown in the figure.
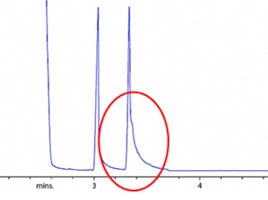
Let’s suppose we come to set up the analysis and discover that the actual chromatogram obtained for the analysis looks different to this – perhaps more like that shown in Figure 2.

Figure 2: Problem chromatogram obtained using nominally the same conditions to Figure 1.
Comparing the chromatogram obtained in Figure 2 with the reference chromatogram from our method (Figure 1) is concerning as the relative spacing of the peaks (the selectivity) have clearly changed. When such changes occur, it is always good practice to measure the efficiency of the peaks to help us in our diagnostic activities. It should be fairly easy to spot that the peaks do appear broader and the retention times as all peaks have shifted to a later value – note this as we investigate further.
First, let’s quickly recap what chromatographic changes may result in differences in selectivity which, under GC conditions, are relatively few. Retention in gas chromatography can be described using a form of Henry’s Law (Equation 1);

Where k is retention factor, R is the ideal gas constant, T is temperature, ns is the total number of moles of stationary phase within the column, and Vm is the volume of mobile phase (carrier gas) within the column. The other two parameters are solute dependent, helping us to understand the variation of retention factor with changing solute chemistry. They are;
![]() – is the absolute vapour pressure of the solute and is heavily influenced by temperature
– is the absolute vapour pressure of the solute and is heavily influenced by temperature
![]() – is the activity coefficient of the solute within the stationary phase and is heavily influenced by the solubility of the solute within the stationary phase
– is the activity coefficient of the solute within the stationary phase and is heavily influenced by the solubility of the solute within the stationary phase
Without delving too much into the mathematics of Equation 1, it should be stated that if either of the two parameters described above is altered, then the RELATIVE retention factor of the solutes within the stationary phase will change independently of each other, and a change in selectivity (relative retention factor) will occur. So how might we find ourselves falling foul of unexpected changes to the activity coefficient (solubility) of the solute within the stationary phase?
The most obvious answer here is that we might simply install a GC column with the ‘wrong’ stationary phase, that is, we install a 35% phenyl methyl polysiloxane rather than the 5% version of the same phase; DB-35 instead of DB-5 or Rtx-35 instead of Rtx-5 and so forth (depending upon your favourite manufacturers naming conventions). As we have changed the chemistry of the stationary phase, then we might assume that the analyte solubility, therefore the activity co-efficient may change. Simply checking the column phase description on the column hanger tag will lead to a swift diagnosis in this case. It’s prudent never to believe the description written on the GC column box you acquired from the drawer, someone may well have a placed a different GC column into that box! This theory may also fit with the later retention time also seen in Figure 2.
However, there are also more subtle changes in column chemistry that are a little more difficult to spot. In changing from a 5% phenyl polydimethylsiloxane phase with ‘pendant’ phenyl functionality to that with the phenyl moieties incorporated into the polymer backbone (so called ‘silphenylene’ phases) one might also incur subtle changes to the selectivity of the separation. Figure 3 shows a typical example of these two phases, the silphenylene version being introduced, ostensibly, to reduce phase bleed for MS detection applications and the phase names would be XX-5 for the pendant version and XX-5MS (or something similar) for the silphenylene version.

Figure 3: Monomeric units of the pendant and silphylene versions of a 5% Phenyl Poldimethyl siloxane GC stationary phase.
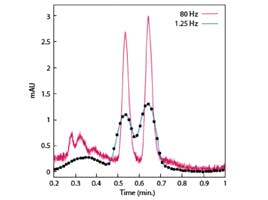
Figure 4 shows two typical separations using these phases and as can be seen, one needs to be mindful when selecting stationary phase chemistry as these subtle differences in phase name can often lead to fairly selectivity changes. Indeed, most manufacturers try to improve their stationary phase chemistry over time, and whilst this is to be applauded, we need to evaluate the changes that may occur with our analytical methods prior to switching. In recent times, the manufacturers have strived to improve the deactivation characteristics of the stationary phase, primarily to reduce peak tailing for polar and ionogenic compounds, and again some of these improved phases have resulted in selectivity changes between the traditional and improved versions.

Figure 4: Comparison of separation between pendant and silphenylene phases for the pesticide separation of Figure 1 – all other conditions remain identical.
Another way in which we can fall foul of changes in the activity coefficient within a GC method is to select a column with a different phase ratio – which is typically seen when a column of the same length and internal diameter is used with a different film thickness. In theory, altering the phase ratio (in this case the film thickness), is not meant to produce changes in chromatographic selectivity, after all we are not changing anything related to the chemistry of either that the stationary phase or the solute molecule.
However, in practice we often see changes in separation selectivity and for several different reasons. A change in film thickness (df) brings about different changes in retention and efficiency for earlier eluting (k<5) and later eluting (k>5) analytes, those at the interface of this boundary can shift relative to each other. More volatile, earlier eluting analytes tend to show improved resolution whilst the less volatile analytes show a decrease in resolution, primarily due to changes in separation efficiency.
The effects of screening the underlying silica to which the stationary phase is bonded and the effect this has on selectivity is perhaps more important. The thicker the applied bonded or immobilised phase, the more shielding there is against, for example, unreacted silanol groups of the silica/stationary phase interface and indeed to some of the silica deactivation chemistry. Whilst it is impossible to predict the effect on our chromatogram (i.e. we cannot predict if using a thicker phase will improve or degrade the selectivity) changes do occur. One might mistakenly select a column with the incorrect film thickness and again always check the column hangar tag on installation or during troubleshooting. Hopefully, this is a rare occurrence.
The film thickness of the deposited stationary phase is sometimes calculated rather than being directly measured by the manufacturer and it may be that the tolerances applied are wider with some manufacturers and therefore very subtle selectivity changes can occur. As phases age, displaced stationary phase at the inlet end of the column can migrate can collect at a point further down the column, which appears as a ‘bubble’ shape, with drastically increased film thickness. This can also alter the selectivity and efficiency of the chromatogram. This is often the reason why trimming the first few meters of a column can make such and marked difference to column performance. Figure 5 shows an example of altered selectivity when a 0.5μm film is selected instead of the original 0.25μm film, all other parameters remain constant.

Figure 5: Changes in separation selectivity of a pesticides separation due to change in stationary phase film thickness.
The other term within Equation 1 which can affect selectivity is temperature. Whilst there should be no unexpected changes in temperature as our temperature programs within a method are generally fixed and built into the acquisition method, we should consider this term and how we might be susceptible to unexpected changes.
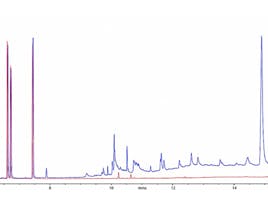
Figure 6 shows the resulting chromatograms from changing the temperature ramp rate from 8 oC/ min to 6 oC/min.

Figure 6: Selectivity differences in a pesticides separation caused by a 2oC different in temperature ramp rate.
Figure 6 clearly shows the changes in selectivity that might occur with only subtle variations in temperature program profile and heating rate within the temperature gradient. It should be noted that, especially when performing fast temperature gradients, not all instruments are created equally. Differences in instrument age or manufacturer will mean that heating rates are not always as they appear within the method (i.e. lag of the actual oven temperature versus time). This is especially important when transferring GC methods—be aware of the capabilities of the oven programming as small differences in actual versus programmed temperature profiles may result in selectivity changes. A variation of this situation is also true when considering columns of subtly different lengths. Trimming 1-3 meters from a 30-meter column may not only affect retention and efficiency, but due to differences in elution temperature of analytes from the shorter column, may also affect the actual temperature profile experienced by the analyte at various points within the GC column. An example of this phenomenon is shown in Figure 7.

Figure 7: Selectivity differences in a pesticides separation caused by small changes in column length.
Whilst a 10% change in column length (volume) may appear inconsequential, Figure 7 clearly shows the impact on selectivity, all other conditions remaining exactly the same. In reality, this would only take 3 ‘column-trimming’ operations of 1 m each, something which one might easily envisage over the lifetime of the column as operators strive to maintain the efficiency of a heavily used GC column. If looking for changes in retention when the column is shortened, such drastic changes in the selectivity of the separation may be unexpected! Again, any column trimming should be recorded in the column log and/or written onto the column tag using permanent marker to allow the actual column length to be used in the instrument set-up. It is far less likely that such changes in selectivity will occur if the linear velocity is kept constant by updating the actual column length in the instrument method.
One further potential cause of selectivity issues is alteration of the sample solvent. Whilst selectivity changes tend to be reasonably subtle, and peak shape differences may give the biggest clue to this change, the way in which the analyte is deposited in the first few meters of the phase can be critical. This will depend upon a combination of the sample solvent, the stationary phase chemistry and the initial oven temperature and hold time. One should take great care, when changing sample solvent, to assess the effects on the selectivity of the separation.
Besides the fairly obvious error of selecting the incorrect GC stationary phase, there are several esoteric factors that can also play a part in altering the separation selectivity and many of these are difficult to pinpoint. Checking the phase dimensions, stationary phase chemistry and acquisition method are the obvious starting points. I hope that this discussion will also give you some hints as to other possible causes.
If you missed them why not check out the first three instalments in this series:
GC Diagnostic Skills I | Peak Tailing
Related articles