11 Feb 2020
HPLC Diagnostic Skills III – Systematic Investigation of Selectivity Changes
Continuing our series of articles on HPLC diagnostic skills, this article outlines the best way to investigate selectivity changes. Part 1 covered noisy baselines, whereas part 2 detailed troubleshooting methodologies for peak tailing. So how do selectivity changes fit into the dark art of HPLC troubleshooting?
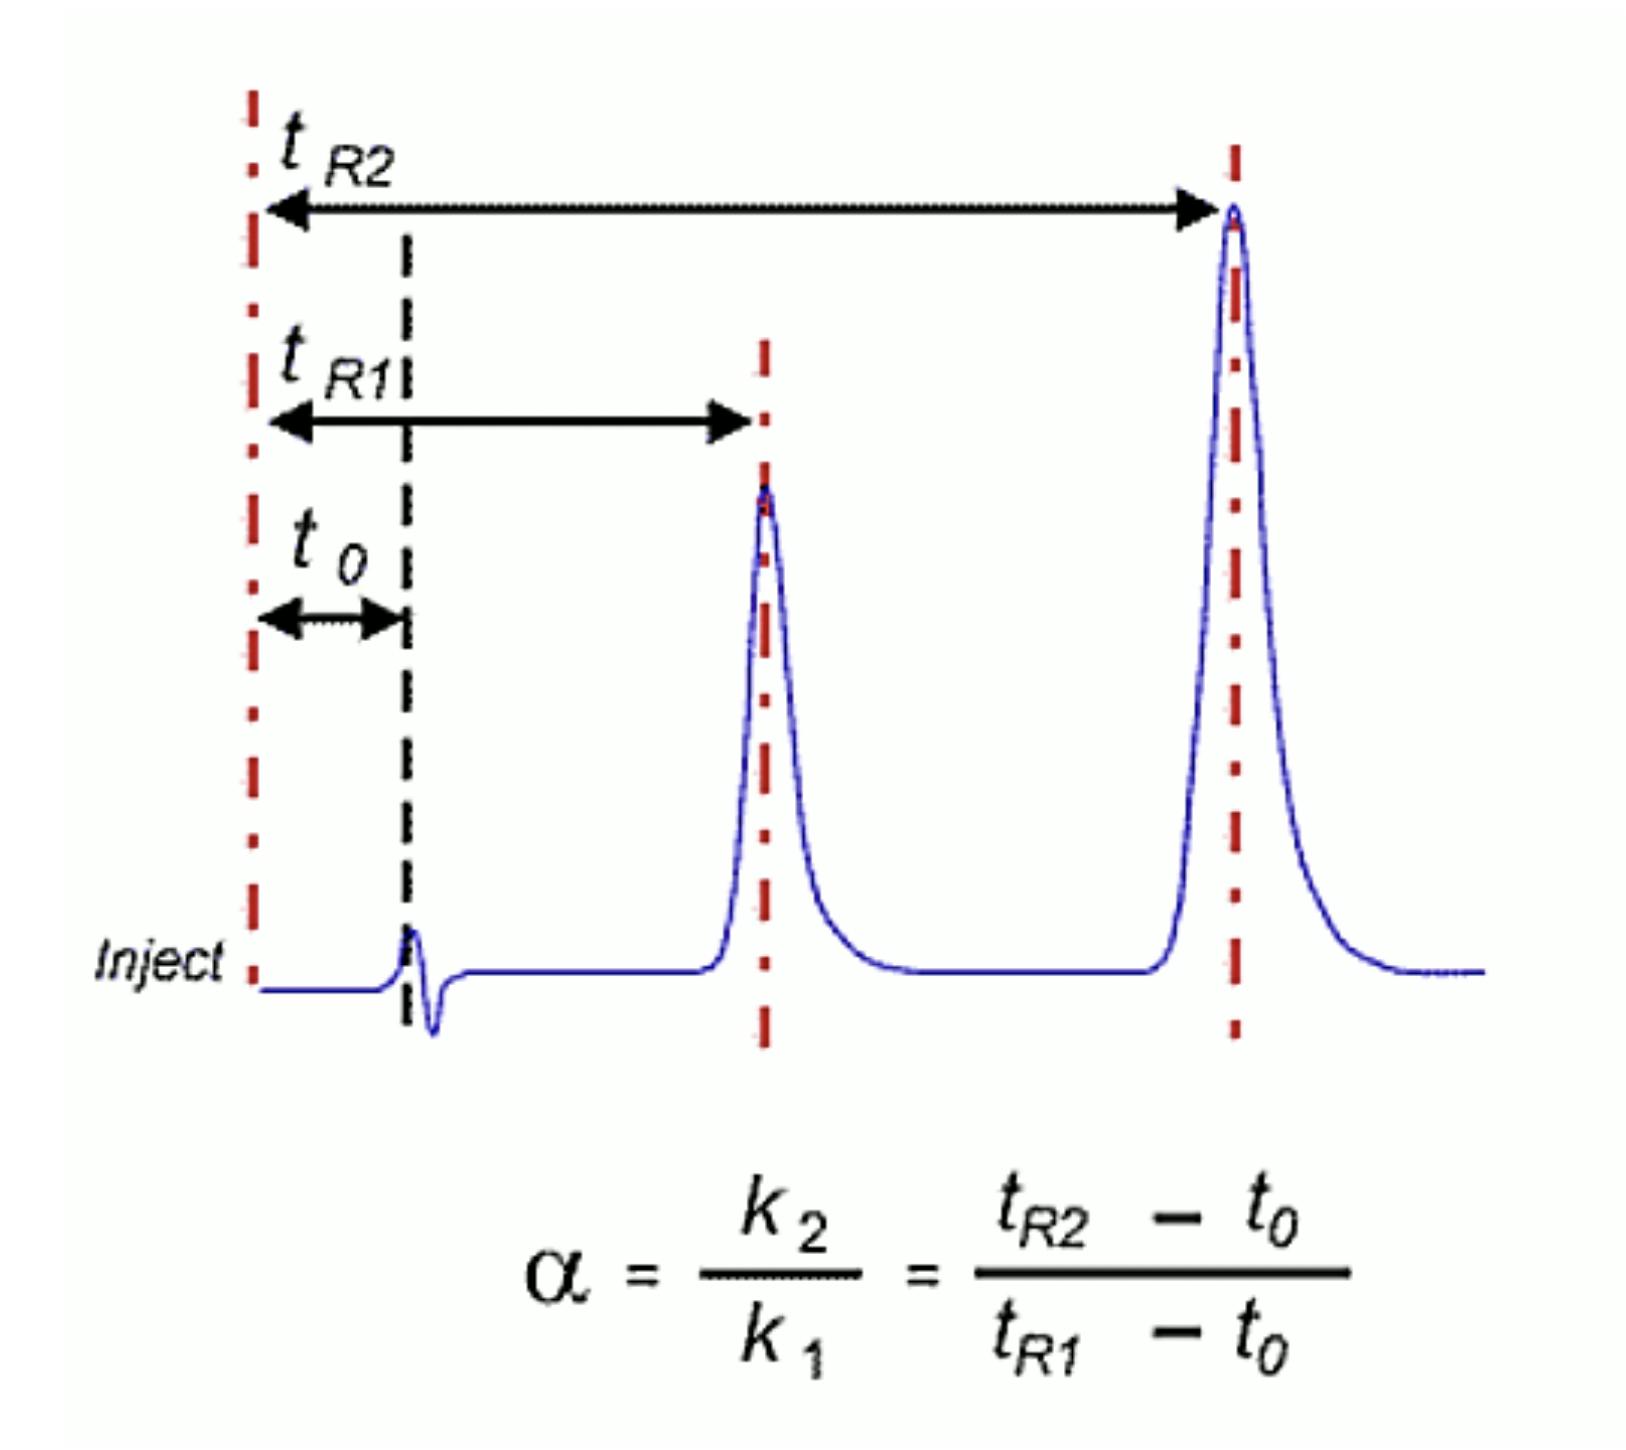
The selectivity (α) of an analytical system describes the ability to discriminate between sample components based on different chemical and physical-chemical properties. In chromatography, it describes the spacing between the apices of the peaks within the chromatogram (Figure 1). This is determined by the analyte properties and those of the stationary phase and eluent system.

Figure 1: Mathematical determination of selectivity (a) from a chromatographic output
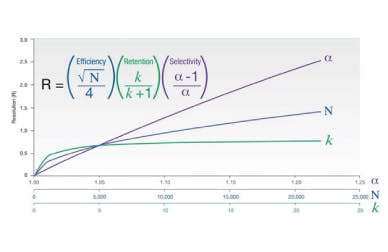
The selectivity obtained by an analytical method is fundamentally important to chromatographic separations. In combination with peak efficiency (crudely, peak width) it determines the resolution of peaks within the chromatogram. When selectivity changes, resolution may decrease, making peak area measurement less accurate and reproducible, as well as decreasing confidence in peak identification or spectral structural elucidation.
Selectivity changes can range from subtle shifts in relative retention of a single peak within the chromatogram to wholescale retention order swapping of every peak. Spotting these changes and investigating the causes in a systematic and proficient manner is important. However, with so many variables affecting selectivity, it is sometimes difficult to know where to begin a diagnostic investigation.
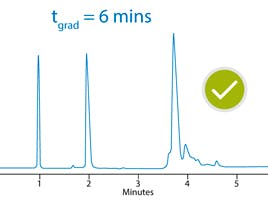
Figure 2 shows an example of a subtle change in chromatographic selectivity (peaks 1 and 2) which led to difficulties with accurate peak quantitation.

Figure 2: Change in selectivity for the separation of pharmaceutical test compounds (relevant analyte pKa values shown in brackets)
As we can see from Figure 2, the selectivity change is also accompanied by a slight shift to later retention. When retention shifts occur, it’s a good idea to check the selectivity values for the peaks in question to confirm a change to selectivity. In this case, it’s visually obvious that a change to the chemistry of the system has occurred. It's time to invoke the selectivity diagnostic checklist to investigate the issues.
Note that the checklist is in order of ‘ease and probability’. In other words, things which are simple to check are included earlier in the checklist, to make investigations as efficient as possible.
1) Check the gradient profile of the method
Check that the correct gradient profile has been entered into the CDS system acquisition method. Enter the correct gradient profile if required and re-analyse the sample/standard solution.
2) Confirm correct stationary phase
The column stationary phase is critical to the chemistry of the separation. Checking the correct column (including dimensions) is being used is the first diagnostic check to make.
It is very common for selectivity changes to occur when switching between brands and/or manufacturers, even if the nominal stationary phase chemistry (i.e. C18) is the same. Only use the prescribed phase and manufacturer for the method, unless phase equivalence has been previously established and validated. Change to the correct column if required and re-analyse the sample/standard solution.
3) Check stationary phase batch/lot number against previous ‘good’ separations
The selectivity of certain stationary phases (usually older or more complex) may change between batches or lots, due to subtle or uncontrollable changes in the manufacturing (bonding) chemistry. Selectivity changes can also occur if different column hardware (tubing, frits etc.) are used. Verify the batch/lot number. If they’re different, begin the hunt for a column from the same batch, but do not change the column at this point.
4) Verify correct column temperature
Changes in column (eluent) temperature can affect the selectivity of separations. This can be more noticeable when dealing with ionogenic analytes (as is the case in our example above). Ensure that the correct column compartment temperature is selected in the CDS system and that the correct temperature is established in the column heater using a thermal resistance thermometer (RTD). Adjusting the selected column compartment temperature is sometimes necessary to obtain the correct temperature value as measured using the RTD.
Differences between the eluent pre-heating option between various manufacturers are also worth pointing out. Some systems flow the eluent through a small void volume within the metal fabric of the column compartments in order to pre-heat the eluent to the required column temperature. Even small differences in the volume of the pre-heat section hydraulic path can affect selectivity in very sensitive separations, meaning that differences between HPLC system manufacturers should be borne in mind. Ensure the correct column and eluent temperatures are set and achieved then re-analyse the sample/standard solution. When temperature is suspected as the cause of selectivity differences, switch the separation under investigation to a system which was known to give good chromatography.
5) Check mobile phase pH
The pH of the eluent can make a big difference to the selectivity of separation when analysing ionogenic analytes. In certain cases, a very small change in the eluent pH can result in large selectivity differences. Check using a calibrated pH meter, bearing in mind the best practice approaches for pH meter usage. Ensure that the pH is correct to within 2 decimal places or at least the number of decimal places specified in your method. Bear in mind that when using volatile mobile phase additives (formic acid, trifluoroacetic acid, ammonia, etc.) that the additive may be lost over the course of a long campaign of analysis. Therefore, pH may ‘creep’ over time. Try to avoid mistakes with eluent preparation by specifying if pH modifying additives are to be added in weight/volume (w/v) or volume/volume (v/v) fashion (i.e. 0.1% formic acid v/v rather than just 0.1% formic acid). The best and most accurate policy is to prepare eluent systems gravimetrically. This is beyond the scope of this article but read reference 1 for more information. Check and correct the eluent pH, combined with check 6, prior to re-analysis.
6) Check the eluent eluotropic strength and buffer concentration
Ensure that the correct organic modifier solvent and solvent channels are used in the CDS method. Where mobile phases are pre-mixed, measure each volume separately before mixing, in order to avoid volume changes and inaccuracies due to latent heat of mixing. This is especially true when using methanol as the organic modifier.
Ensure that the correct buffer salt, pH modifier, or additive are used (for example disodium hydrogen orthophosphate does not have the same chromatographic properties as sodium dihydrogen orthophosphate. The correct weights or volumes of the additives are also vital. As previously stated, check if additives are specified as volume/volume or weight volume. Once these checks have been carried out or a fresh eluent has been prepared, re-analyse the sample or standard solution and check the selectivity. If the HPLC column is the same batch/lot number as the original column, then this would be a good time to try the new column and assess the selectivity.
Again, note that any volatile eluent additives may evaporate on standing and this may affect both retention and selectivity over long analytical campaigns or between batches where the eluent has been allowed to stand on the instrument.
7) Check dwell volume differences between instruments
In gradient HPLC, differences in the way that the eluents are mixed (binary versus quaternary pumping systems) or differences in the system volume between the point at which the eluent is mixed to the head of the analytical column, can cause differences in retention time and selectivity of the separation. When switching between HPLC systems for a particular method, verify that these inherent system differences have been accounted for. This is usually achieved by adding an isocratic hold to the initial portion of the gradient or even by introducing an injection delay, whereby the sample is injected at some time after the gradient has started. The details of the underlying theory and corrective actions can be found in Reference 3.
This problem is common. As such, if all other checklist items have been implemented then switching the column and eluent system to match the last satisfactory separation will indicate issues with dwell volume. Use reference 3 to adjust the gradient characteristics and re-analyse the sample/standard solution.
8) Verify gradient mixing, plus delivery accuracy and capability
Sometimes instruments get a little worn out and their capacity to mix the gradient in an accurate or reproducible fashion diminishes. In this instance trying a different instrument is probably the simplest solution in the short term. Quaternary pumps, which mix the gradient using a series of electronically actuated valves on a ‘time’ basis are more prone to gradient mixing inaccuracy than binary pumps, which deliver the correct eluent composition based on differential flow or piston stroke volume.
There are various tests to identify the effectiveness of the quaternary mixing valve. The simplest is to dope the eluent (channel B) with 0.1% v/v acetone and measure the UV response at 268nm during a gradient which is programmed in ‘steps’ of 20% per segment. I.e. 10% B for 5 minutes, 10% B per minute until 7 minutes, hold for 5 minutes at 20% B and so forth.
Replace the mixing valves if necessary, noting that sometimes that eluent mixing issues can be caused by cavitation induced by blockages in the sinker/filters within the eluent reservoirs. These should also be cleaned as necessary, following your manufacturers recommended cleaning process, on a regular basis.
Programming ballistic gradients can lead to over-ambition—those which rise over a large range of eluent B in just a few minutes or even seconds. It could be argued that the method under investigation falls into this category.
Unless the highest efficiency, lowest dead-volume pumping systems is in use, then the instrument may not be to able to accurately or reproducibly deliver the required gradient. Again, a detailed treatment of this topic is beyond the scope of our discussion here, but reference 4 contains more details on this topic. Once any instrument problems have been rectified.
Utilising The Checklist, In Example
This example follows the checklist to item number 5 and found that there was an error in the eluent preparation, which had been prepared volumetrically rather than gravimetrically. 0.01% formic acid prepared volumetrically had resulted in an aqueous solution pH of 3.22, whereas the gravimetric method resulted in a solution pH of 3.27. Whilst this difference of 0.05 pH units may seems vanishingly small and inconsequential, when the eluent pH is so close to the pKa value of the analytes of interest, this had resulted in the change of chromatographic selectivity. The separations obtained from the freshly made eluent, compared to the last time the method was run as shown in Figure 3. The further point to be made here is that, in as far as is possible, methods should be designed with the eluent pH at least 1 (and preferably 2) pH units away from the pKa values of the analytes of interest. Undoubtedly the analyst who developed this method used fine control of pH to finesse this rather difficult separation. However, perhaps a better route would have been to have the analytes in their fully ionised or non-ionised forms and sought an alternative column chemistry and/or organic modifier in order to obtain a satisfactory separation. Reference 5 contains more details on this type of alternative approach to method development.

Figure 3: Selectivity comparison of separation shown in figure 1 after troubleshooting (original chromatogram Top). Note the inclusion of w/v in the method conditions.
Note that the study of the gradient delivery performance for the instrument used ascertained satisfactory accuracy and reproducibility. This was ruled out as a potential issue.
In summary, changes in chromatographic selectivity can be amongst the most difficult to diagnose and correct. Establish that selectivity has changed and implement the diagnostic. It represents a logical and time-efficient way in which to isolate and ultimately correct the problems with the chemistry of the separation. Wherever possible, chromatographic separations should be designed with robustness in mind, and where this is not possible, method specifications should be carefully written in order to highlight the key variables within the separation conditions.
[1] Mobile Phase Buffers in LC: Effect of Buffer Preparation Method on Retention Repeatability, Jul 01, 2019, Dwight R. Stoll, Devin M. Makey, LCGC North America, Volume 37, Issue 7, pg 444–449
[2] Preparing Eluents for HPLC—What You Ought to Know, Dec 01, 2015, Tony Taylor, LCGC North America, Volume 33, Issue 12, pg 922
[3] The LCGC Blog: Dwell Volume – Still Relevant in our UHPLC World?, Sep 12, 2017, Tony Taylor
[4] The LCGC Blog: HPLC Gradients - Getting It Right! Issues with HPLC Gradient in Reverse Phase Chromatography, Tony Taylor, May 14, 2013
[5] The LCGC Blog: Generic Methods – The Potluck Supper of Analytical Chemistry?, Nov 15, 2016, Tony Taylor
Related articles