01 Nov 2017
Useful free tools for HPLC method development
I’ve done that thing where I’ve stated a very interesting title — I hope I can deliver something which lives up to it. I dislike it when people ‘overstate’ their talk or poster titles at conferences to draw me in and then don’t deliver against the promise – I’ll let you judge how we go here. First, let me explain.
I was investigating a separation that I was adapting from a manufacturer's application note [1] and wanted to check the observable effects from changing column selectivity.
Here are the analytes and the separation on an Agilent Poroshell C18-EC column (end-capped) and the associated separation from a variety of steroids that we have been working on.
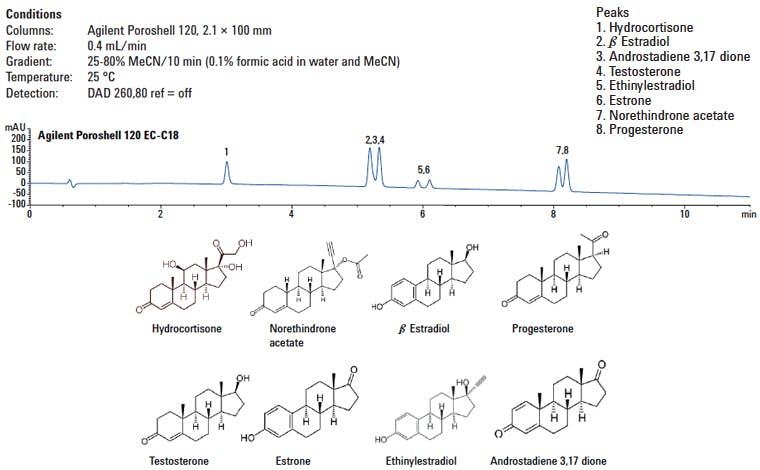
Figure 1: Initial separation of a range of steroid analytes using an end-capped C18 core-shell column.
I wanted to check the elution order and how this correlated with the hydrophobicity of the analytes and if any other factors were dictating retention and selectivity on this ‘standard’ end capped octadecylsilyl column.
When I started my career, some 30 years ago, this would have meant a good chunk of time spent with the Handbook of Chemistry and Physics [2] in the hope that I could find all of the relevant analytes. These days, it’s possible to find most physicochemical information online. One website that is worth your attention is Chemicalize — www.chemicalize.org — developed and maintained by CHEMAXON. This contains most of the useful measurements that we need to help us understand the analyte behaviour of a wealth of common (and some not so common) species. To demonstrate the capability, figure 2 is a screenshot of a search on estrone.
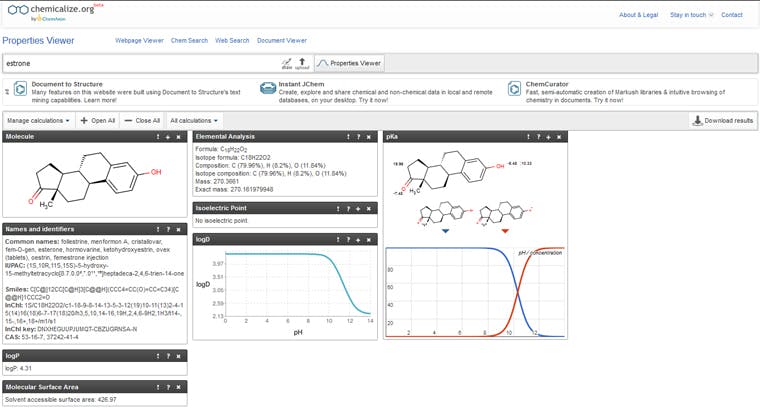
Figure 2: Screen shot of some of the information available from Chemicalize. (www.chemicalize.com)
I’ve only shown a limited amount of information available from the site in Figure 2 as this is what was required for my particular application but I’d encourage you to explore all of the other useful information for yourself. It is really straightforward to obtain information on hydrophobicity (LogP & LogD) as well as pKa, molecular weight, molecular geometry, polar nature, surface area, and other very useful data.
Figure 3 shows the C18 separation — again tabulated in elution order against the physicochemical parameters that are thought to affect this separation.
Figure 3: Initial separation of a range of steroid molecules using an end-capped C18 core-shell column and some relevant physicochemical chemical parameters of the analytes.
As you will see, for the most part, the elution order increases as hydrophobicity increases (increasing values of LogP, the octanol/water partition coefficient) as one might expect in reversed phase chromatography. However, the later-than-expected elution where this trend is not followed (by testosterone for example) can be explained by an increase in accessible acetonitrile solute surface area. Again, this is a very useful predictor of retention in reversed phase HPLC and represents the relative area available for the solvent or the stationary phase to interact with.
Before moving on to investigate the selectivity options from other phases, I wanted to predict the retention time of an analyte — an acid analogue of the androstadienedione molecule. Unfortunately, this analyte is not contained within the Chemicalize database. But that’s okay because ChemAxon offer another free resource called MarvinSketch (https://www.chemaxon.com/products/marvin/marvinsketch) — a chemical structures drawing program containing some free plug-ins that can estimate/calculate the same physicochemical parameters which we’ve used to analyse the separation so far. After drawing the acid analogue, the plug-ins were used to predict the physicochemical data which is shown in Figure 4.
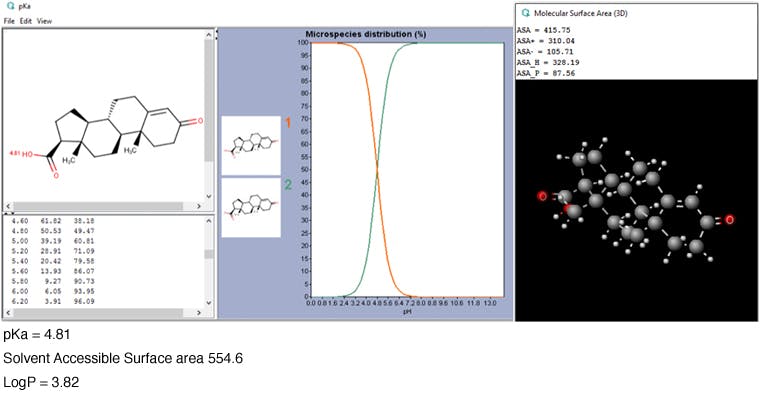
Figure 4: Some selected outputs from the calculation performed in MarvinSketch on the acid analogue of the Androstadienedione analyte.
We didn’t have the analogue synthesised at the time of doing this predictive work, however, we could estimate that the analyte may elute in the fairly ‘crowded’ area around peaks two and three. So, how do we select columns in order to try and improve the separation between these closely eluting analytes while improving the separation between already co-eluting peak pairs? Are there any tools available which will allow us to predict the type of phase that we might want to use?
There are several models for describing stationary phase selectivity which I’ve discussed previously (http://www.chromatographyonline.com/column-selection-hplc-method-development) so I won’t cover the basics here – although some selectivity characteristics knowledge of the columns you wish to consider for the analysis is immensely helpful. The next really useful tool then, is the database of column selectivity which is maintained by Dwight Stolls’ group at Gustavus Adolphus College, which can be found at www.HPLCcolumns.org.
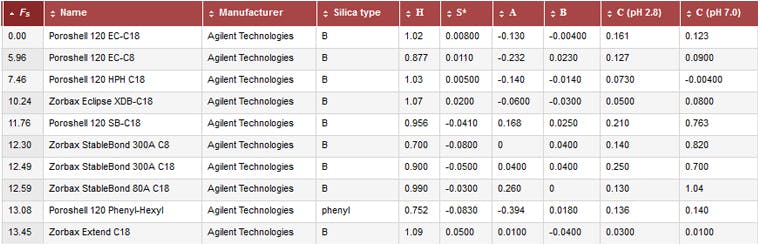
Figure 5: Selective screen shot from the www.HPLCcolumns.org
You will see that the database characterises the columns as per the parameters described in the hydrophobic subtraction model (HSM) [3]. This database is very useful for finding the HSM data on just about every reversed phase column in existence, as well as looking for similar, orthogonal column chemistries, and highlighting columns which have dominant characteristics for the retention and separation of target analytes.
Putting the database above to use, I looked for two columns that I thought might give different characteristics to those of the C18 we started with. The results of my findings are shown in Figure 6. The excel spreadsheet radar plot output is from a tool that we created here at Element; however, making something similar is straightforward.
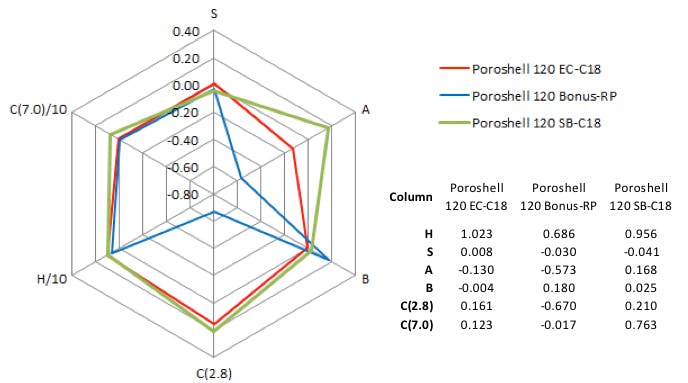
Figure 6: Column comparison data on the original column and two further candidates for the separation.
Before I go further, I should point out that this is unweighted data. Data should be weighted for the various analyte characteristics. The database at www.hplccolumns.org is really useful for this.
Secondly, I’m in no way claiming that we can do any sort of quantitative structure/activity correlation with the tools that I’m discussing. For that type of development, you should be following the work of Paul Haddad’s group at the University of Tasmania and their various collaborators. I’ve cited one paper in Reference 4 for you to start from.
However, it is useful to begin to relate the selectivity properties of the columns to what ‘might’ and what ‘does’ happen in practice. Or even to select columns based on what interactions you THINK might be dominant in the analyte/stationary phase interaction. In this way, our column selection and method optimization can be much better informed.
Again, without going into too much detail – we can relate the results from the databases with the stationary phase characteristics to postulate what might happen when various phases are used. Here we picked a non-endcapped phase, which is sterically protected with bulky iso-butyl substituent groups on the bonded ligand, as well as a polar embedded column which typically contain a carbamate or imide functional group within the alkyl chain.
Note that the structures shown in Figure 7 are representative of the ‘type’ of ligand used — they do not represent the actual chemistry of these phases. Further, we’ve represented the chain lengths on each ligand in a rather unconventional way for convenience and space!
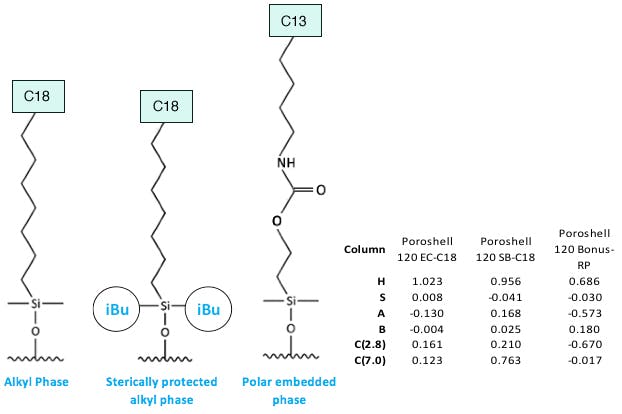
Figure 7: Stationary phases of the ‘type’ used in our experiments.
So, what differences in the separation can we expect from these alternative phases, given the data from the column selectivity database?
The StableBond (SB C18) column will give approximately the same hydrophobic retention but will show increased shape selectivity. This will result in increased retention for sterically more bulky and less polar analytes. It can be expected that more polar or ionogenic analytes will not show the same extended retention.
It’s important to note that the StableBond column is non-endcapped, and had the separation been carried out at pH values above 6, the selectivity might have looked very different. This is due to the acidic surface silanol groups becoming ionized (pka is around 4) and the polarity of the surface changing markedly — becoming increasingly anionic — which is reflected in the high, pH 7.0, value displayed by the ion exchange capacity. However, the eluent for this experiment was pH 2.8 (approx.) after adjustment with 0.1% formic acid and as such we expect any acidic silanol groups to be non-ionised; therefore, they have less effect on the separation.
Figure 6 indicates that the polar embedded bonus RP column will show much greater retention of acidic species due to interaction with the embedded basic group in the ligand, and much lower retention of basic species, as any exposed surface silanol groups are ‘shielded’ by the embedded polar ligand. In general the hydrophobic retention of this column is lower, so any less polar compounds should show shortened retention times.
The actual chromatograms obtained are shown in Figure 8, alongside the original chromatogram from the end-capped C18.
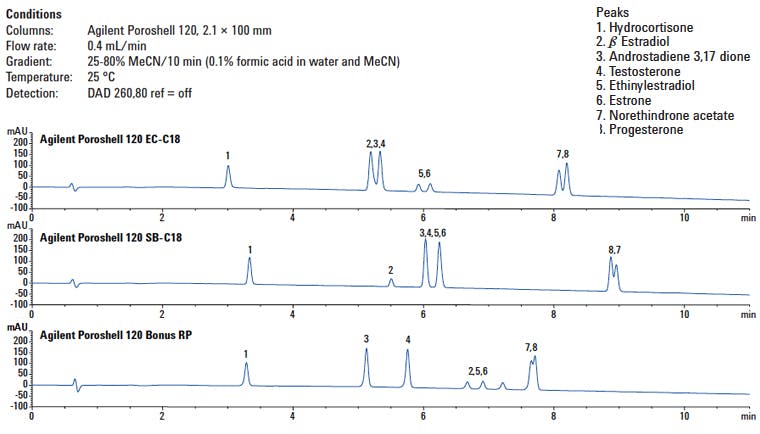
Figure 8: Separation of various steroid analytes using three different ligands to explore the selectivity obtained in comparison with changes predicted using a column comparison database.
Without undergoing an in-depth debrief on the results, it can be seen that the SB-C18 does indeed show extended retention for the less polar analytes and those without a polar or ionisable functional group are effectively retained to a lower degree which is entirely in keeping with an increase in the shape selectivity of the phase. Compounds 2, 5 and 6, which are very weakly acidic, are effected less markedly.
The bonus RP column shows reduced retention of the non-polar compounds and a markedly higher retention of the acidic compounds (2, 5 and 6) as predicted. This separation certainly gives a much better opportunity to ‘insert’ the acidic androstadienedione analogue which will hopefully belute just before or after compounds 7 and 8.
Whilst the separation was still not optimised, a successful separation was eventually affected using a phenyl hexyl functional column with methanol as the eluent modifier. My point here is — there are a host of tools available to help guide our HPLC method development and optimisation choices. We should all be taking full advantage of them!
I also appreciate that I’ve highlighted only a limited set of tools here and readers and vendors alike will be keen to let me know of their versions of these tools or other tools that can be used.
- Fast Screening Methods for Steroids by HPLC with Agilent Poroshell 120 Columns, Agilent Application note 5991-0451
- CRC Handbook of Chemistry and Physics, 96th Edition (15 Jun 2015), Editor-in-Chief W. M. Haynes
- Wilson NS, Nelson MD, Dolan JW, Snyder LR, Wolcott RG, Carr PW Column selectivity in reversed-phase liquid chromatography: II. Effect of a change in conditionds. Journal of Chromatography A 961, 195–215 (2002).
- Talebi M, Schuster G, Shellie RA, Szucs R, Haddad PR. Performance comparison of partial least squares-related variable selection methods for quantitative structure retention relationships modelling of retention times in reversed-phase liquid chromatography. Journal of Chromatography A 1424, 69-76 (2015).
Related articles