06 May 2020
Van Deemter equation - The Lockdown guide
Linear velocity is an important method parameter in chromatography and is affected by changes in flow rate, temperature, column dimensions, mobile phase type and is one of the more important factors to consider when trying to transfer methods between systems or when trying to reproduce chromatograms. It can also be used to adjust the runtime and/or alter the separation observed in the chromatogram so understanding the effects of adjusting it is important in method development and troubleshooting.
I have four daughters, aged 8, 6, 4 and 2 and I like to use them during my training sessions to try and explain some of the concepts in ways people will remember!
For example, imagine all four of them at the ice rink, wearing skates, and I want to get them from one side, with me, to the other side, where my wife is waiting. To get the biggest one across, I need a large push to make sure she gets across in one go but if I give the littlest one the same push, let’s just say my accuracy might be a little off because of it. (At this point I would like to point out that I have not carried out this “experiment” …. yet). If you can picture this, then you understand repeller voltage on a GC-MS system. The repeller “pushes” ions out of the source and through the instrument and it can be tuned for small or large molecules.
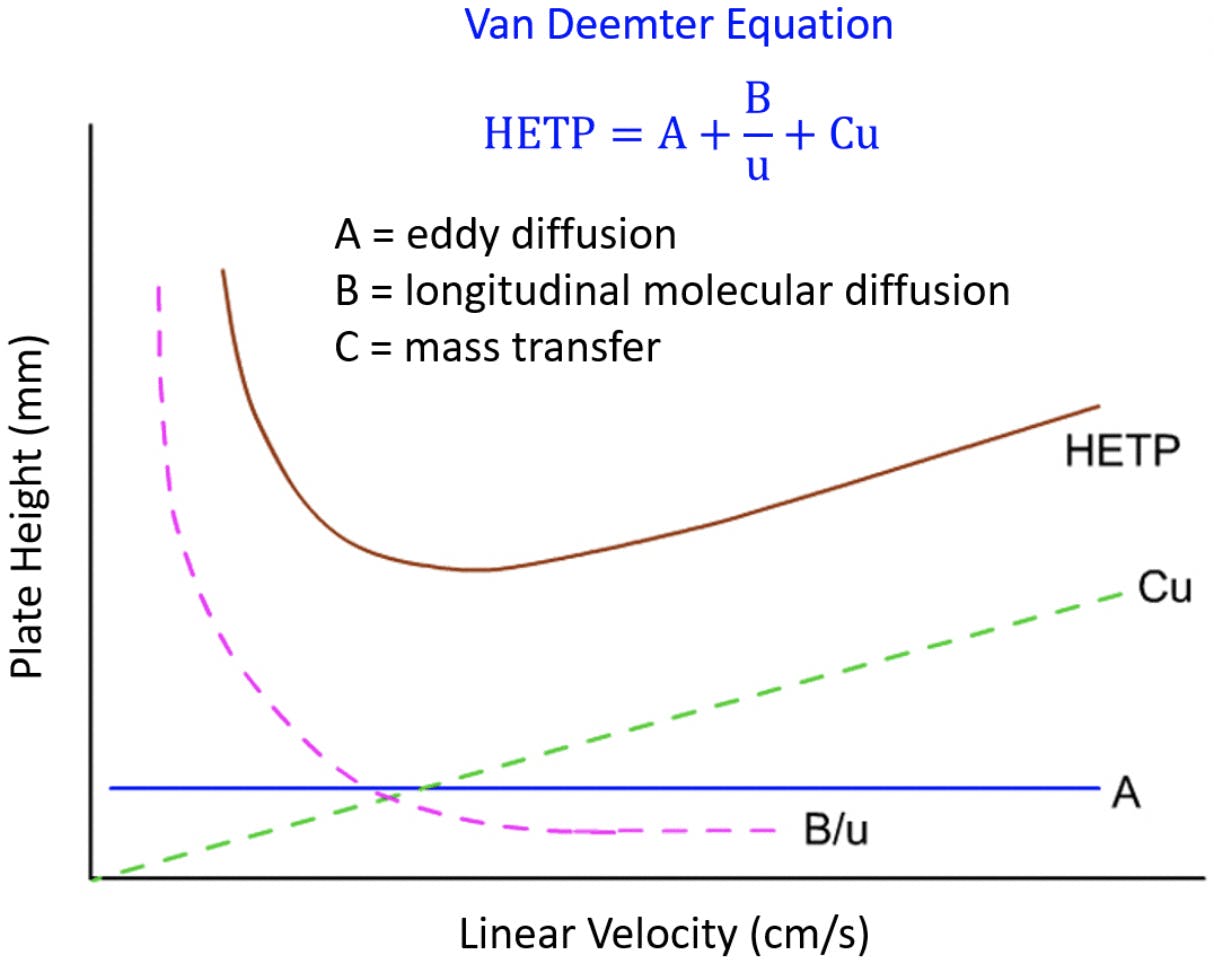
I try this same approach with an equation people have certainly been taught but are never brave enough to explain during a training session, the Van Deemter equation. This equation shows the relationship between peak efficiency and linear velocity and please see the Chromacademy module on band broadening for the proper explanation (the videos used in this article are from Chromacademy).

Let us explain some of the graph before we dive into the analogies.
The y-axis is labelled as the plate height and the lower it is, the sharper the peaks and this is what we want. The x-axis is the linear velocity and we will simplify this and think of it as flow rate for now.
The curve labelled HETP is the composite curve and if we look at it we can see it can be explained in three parts, something is keeping it from the x-axis (the A-term), something is giving the shape on the left of the minimum (the B-Term) and something which gives the shape on the right of the minimum (the C-Term).
The A term – Eddy Diffusion
It is a rare sunny day, so the girls want to get their bikes out of the garage at the bottom of the garden and go for their hour’s exercise. The trouble is that the garden has all the lockdown toys strewn across it, so they cannot just walk in a straight line, door to door. Instead they come out of the back door and must walk around all the obstacles and each one will take a different route. If the obstacles are large, such as the swings or the trampoline, then the deviation in their routes will be large. If the obstacle is smaller like a football or a water-gun, then the deviation will be smaller as well. Every time they walk down the garden, they will take a different route, each one having a different distance travelled.
In columns, the particles are the obstacles and the girls are the same molecule. The larger the particle, the greater the deviation in their journey and the broader the peak will be (Figure 1), and therefore UPLC columns have shaper peaks than traditional HPLC columns (Figure 2).
Figure 1: Eddy diffusion - large particles
Figure 2: Eddy diffusion - small particles
Changing the flow rate will not have a significant impact on the A term because they still will be taking the different routes (Figure 3, 4).
Figure 3: Laminar flow profile
Figure 4: Non-laminar flow profile
The B term – Molecular Diffusion
At the start of a lockdown day, all four girls are around the kitchen table, sorting their Lego so they can build a giant animal kingdom and bring in each of their toys to play in it. By mid-afternoon, they are at other ends of the house not talking to each other, keeping their own Legos to themselves.
Molecules are like children, the longer they are trapped in space together, the more they will push each other away (Figure 5).
Figure 5: Molecular Diffusion - Low linear velocity
This is diffusion and the longer a sample stays in the column, the more it will diffuse and this is a cause of band broadening and as we see in the figure, faster flow rates will get the sample out quicker giving it less time to diffuse and give shaper peaks (Figure 6).
Figure 6: Molecular Diffusion - High linear velocity
Faster flows = less time in the column = lower H = shaper peaks!
The C term – Mass Transfer
Lockdown is over so I decide to take them to the Natural History Museum for a little real-life education. I walk through the door and see the giant blue whale and the girls decide they want to go in different rooms. The eldest is off to the dinosaur room, the second eldest is off to the aquatic rooms, the third is off to the gift shop and the four stays by my side.
If I walk slowly through the museum, the girls have time to walk around their exhibits, come back out and see me and follow me towards the exit (Figure 7).
Figure 7: Mass transfer - Low linear velocity
If I walk quickly through the museum, I will be back onto Cromwell road before they come out of their exhibits (Figure 8).
Figure 8: Mass transfer - High linear velocity
For molecules in a column they will see the stationary phase and some of them will penetrate it, either the film in capillary GC or the pores of particles in HPLC. The ones that penetrate will take time to re-enter the mobile phase stream and therefore slower flow rates will mean smaller gaps from the ones that did not penetrate
The graph shows that there is a balance between the B term and C term as one is improved by slower flows and the other is improved by faster flows so understanding where you are on the curve will allow you to determine if you can increase or decrease your linear velocity for your need.
Hopefully, this explanation will allow you to remember the Van Deemter equation in the future and when the next person asks if they can adjust the flow rate in their method, it won’t be a total mystery.
References


