28 Aug 2017
Ghost Peaks in Gradient HPLC
I guess we have all had the issue at some time or other. A blank injection of eluent (or a zero volume dummy injection) gives rise to discreet peaks on the chromatographic baseline which may interfere with analyte peaks or increase the complexity of the chromatogram obtained, especially when performing trace analysis.
Of course this is an undesirable situation and one which can be difficult to understand or troubleshoot as, if we didn’t inject anything, how on earth do we end up with discrete beaks in the ‘blank’ chromatogram?
The secret to understanding the phenomenon lies in understanding the mechanisms of gradient of HPLC.
At the beginning of the gradient, in reversed phase HPLC, the eluent is eluotropically weak – that is, it contains only a small proportion of organic modifier which is the stronger solvent. Thus, anything within the eluent which is even mildly hydrophobic (i.e attracted more strongly the stationary phase) may be ‘trapped’ on the stationary phase at the head of the analytical column (Figure 1).
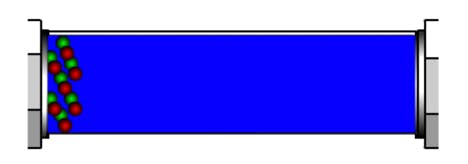
Figure 1: Trapping of hydrophobic analytes at the head of the analytical column at the beginning of an HPLC gradient
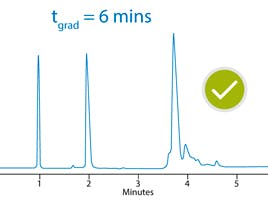
Further, as the eluotropic strength of the eluent system increases during the gradient and analyte bands begin to migrate through the stationary phase bed, the elution strength at the ‘font’ of the band (nearest the detector) will always be slightly weaker than that at the ‘back’ of the band (nearest the injector) as by definition the stronger eluent enters through the column inlet, displacing the weaker eluent from the column. This causes a further 'focussing' process whereby the analyte band is compressed as the rear part of the band moves more quickly than the front (Figure 2). This is one of predominant factors in determining analyte peak width in gradient analysis and why, ultimately, all peaks within a gradient analysis have approximately the same peak width.

Figure 2: Peak compression during gradient HPLC
If these processes are in play for our analytes, unfortunately they are also in play with mobile phase contaminants which can be both trapped and subsequently focussed thorough the gradient analysis, ultimately appearing as discreet peaks within the ‘blank’ chromatogram of a gradient elution analysis. One can also speculate that this is perhaps the reason that isocratic analyses are less susceptible to ghost peaks.
So where do these ghost peaks come from and what steps can we take to mitigate their appearance?
Unfortunately they can arise from most of the reagents that we might typically use in our HPLC system.
In excellent papers by Williams [1] and Taylor et. al. [2] they cite several sources with exemplar chromatograms to highlight the potential sources of contamination – a few of which I’ve highlighted below alongside some of my own observations.
Water used for HPLC – whilst typically pure when used from Winchester bottles (HPLC Grade), there is a distinct possibility that the water from deionising / purification units may contain bacteria if not properly cleaned and serviced. Bacteria produce waste and decompose to give a host of UV active compounds which can give rise to ghost peaks in gradient analysis (Figure 3). Ensure that all water production units are well maintained and that bottles used for eluent reservoirs, seal wash and needle wash are regularly cleaned. Avoid using surfactant based detergents (or any detergents at all!) as these may also give rise to ghost peaks if not properly rinsed (Figure 4). To reduce microbial growth, use at least 15% methanol or 5% acetonitrile in aqueous mobile phases which need to be stored for any length of time and keep eluents in the fridge if they need to be stored. Be sure to regularly clean the sinkers / filters which are placed in the eluent reservoirs as these are known to harbour bacteria (do not sonicate ceramic / glass filters). Consider the use of polystyrene divinyl benzene filters to filter the aqueous eluent portion if problems persist, although the possibility of leaching from the filter / filter housing should be evaluated.
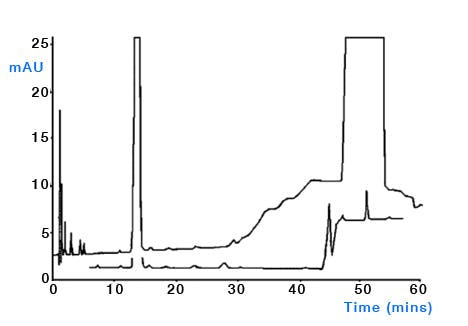
Figure 3: Comparison of a clean and contaminated sequential isocratic step chromatogram. Column: Genesis C18, 150mm× 4.6mm, 4μm, temp.25oC, 1.5mL/min, λ=235nm. EluentA: 750methanol, 250water; eluentB: 900methanol, 100water. Timetable(min,%B):(0,0), (45,0), (46,100), (60,100), (60.1,0), (70,0). (Reproduced from reference 1)
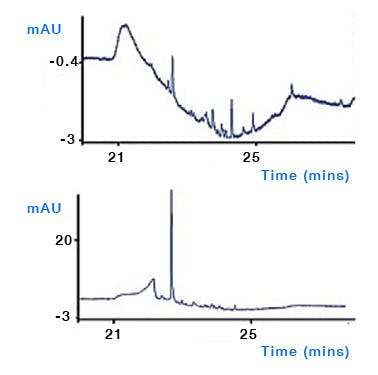
Figure 4: Baseline profiles arising from different sources of mobile phase contamination. Comparison of baseline profiles (254 nm) obtained following enrichment of 60- mL aqueous mobile phase onto a HPLC column prior to elution with acetonitrile gradient. Top: stock aqueous mobile phase showing peaks from enriched trace contaminants (maximum contaminant peakheight (HCmax) = 1 mAU). Bottom: dishwasher detergent (25 μL/L, HCmax = 39 mAU) (Reproduced from reference 2)
Plasticizers – there are many sources of plasticiser within the laboratory and phthalate plasticisers are omnipresent in lab air and on lab surfaces [3]. Avoid the use of laboratory ‘films’ to cover eluent reservoirs, especially those containing volatile solvents or reagents such as TFA as these may leach plasticiser into the eluent via extraction by the volatile vapours. Plastic Pasteur pipettes, Tygon tubing, plastic weighing vessels and nylon gloves have also been shown to be sources of contamination from phthalates and other plasticiser materials [2] (Figure 3). Try to use well rinsed glassware wherever possible and avoid the use of plastic equipment during eluent production, including the use of plastic solvent bottles to ‘top up’ eluents to volume, and don’t store eluents in plastic containers. One further potential source of leachates is from the septa within the cap of the autosampler vial, which when pierced can deposit small fragments into the sample liquid and indeed volatile samples may leach plasticisers and other components directly from the in-tact cap. Various grades and types of septa are available including septa specifically designed to minimise leachates into the sample solution.
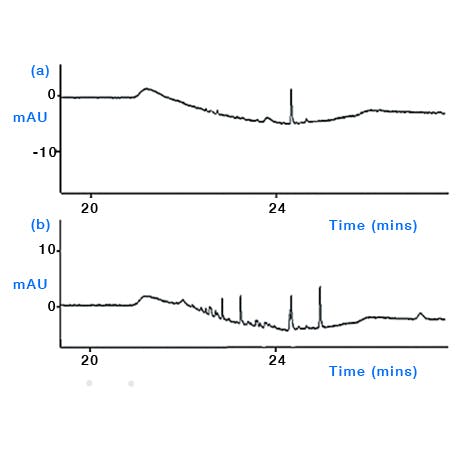
Figure 5: Comparison of the effect of wearing different laboratory glove types when preparing aqueous mobile phase for HPLC. Comparison of baseline profiles (254 nm) obtained following enrichment of 60 mL aqueous mobile phase onto a HPLC column prior to elution with acetonitrile gradient. (a) aqueous mobile phase prepared wearing pre-washed thicker reusable nitrile glove and (b) aqueous mobile phase prepared using thin disposable nitrile gloves showing elevated level and number of contaminant peaks arising from handling the mobile phase inlet line. (Reproduced from reference 2)
pH meter probes – Nelson and Dolan [4] report severe contamination from pH meter probes which have not been properly rinsed, and I have also seen this in our own laboratory. If one considers the complexity of the pH probe surface and the number of solutions into which the probe is placed on a daily basis you begin to realise why such cross contamination might occur. Apart from ensuring that pH probes are properly rinsed, it is good practice to take an aliquot from the eluent reservoir to determine the pH so as not to contaminate the eluent bulk. In these days when reagents are prepared to volumetric or gravimetric ‘recipes’ this may be more practical.
Organic solvents – there is a host of literature on the quality of organic solvents used for HPLC, but almost without exception the rule is to buy the best quality solvents and run some test gradients to assess the true purity of the solvent under the gradient conditions employed in your laboratory. Solvent quality becomes of particular importance when performing trace analysis and/or when using lower UV wavelengths for detection and several stidies have shown the possibility of trace contamination from laboratory grade solvents [5, 6]. Of course, the large scale production of ultra-pure solvents is not a straightforward process and one should not discount the solvent from any investigation into the origin of ghost peaks. Whilst many methods for the further purification of solvents have been investigated [7], the use of adsorbents to remove impurities is typically unsuccessful due to the strongly eluting nature of the organic solvent. One might assess the level and origin of solvent contamination by injecting increasingly large amounts of water to assess the effects or equilibrating with increasingly higher amounts of organic solvent (i.e. increasing the amount of organic at the start of the gradient [6] (Figure 6).
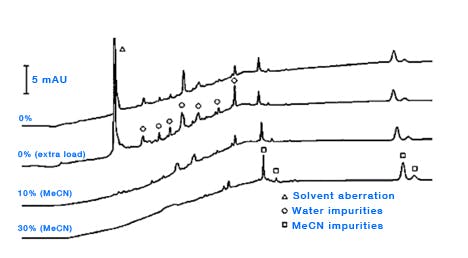
Figure 6: Determining the origin of eluent ghost peaks caused by impurities in water and acetonitrile. Column: Zorbax XDB- C8, 150mm × 4.6mm, 5μm, temp.40oC, 2mL/min, λ=215nm. EluentA: water; eluentB: acetonitrile. Timetable (mins, %B):(0,{0,10or30}), (10,{0,10or30}), (20,100), (30,100), (no re-equilibration time). (Reproduced from reference 1)
Reagents and additives - buffer salts are available in a wide range of purities, some of which are not suitable for HPLC. Deliquescent salts such as ammonium acetate may decrease in purity over time and those supplied in plastic bottles / caps may be susceptible to leachates. Avoid lower quality grades of salts and additives and, where possible, avoid storage in plastic bottles or assess the impact of leachates and carefully control storage conditions and shelf life. TFA is available in a number of grades and oxidises with age, often turning a light brown colour which will increase the UV absorbance of the eluent and also potentially give rise to ghost peaks due to certain oxidation products. Always use the purest grade of mobile phase additive available and run check gradients to assess the likelihood of ghost peaks due to the eluent additives.
Air peaks – air which originates from a poorly performing injection system (siphoning from leaks around the needle or injection valve) can also give rise to discrete peaks within the chromatogram. Aerated eluent has a higher UV absorbance than non-aerated and as such the plug of aerated sample created when the sample is injected under high pressure conditions can mimic a ‘real’ peak within the chromatogram. Keep your autosamplers well maintained and check this phenomenon using a zero volume injection if this is possible on your autosampler type.
System Contamination – build-up of sample contaminants within the system can leach into the eluent as the organic content changes and through gradient focussing can appear as discrete peaks throughout the chromatogram (Figure 7). It’s important to ensure that susceptible areas of system such as needle seats, rotor seals and the internal surfaces of capillary tubing are all regularly cleaned and maintained.
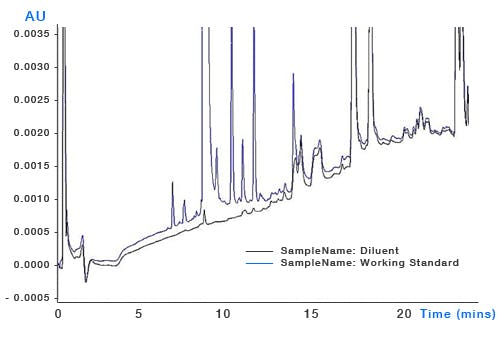
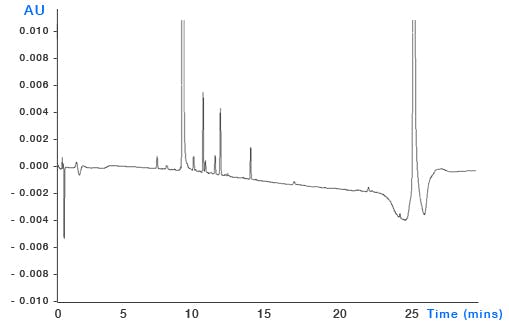
Figure 7: Top – pharmaceutical impurities method (blue chromatogram) and blank injection showing significant contribution from contaminant peaks. Bottom – the same analysis after cleaning and flushing of the autosampler injection valve. Mobile phase: A – 20mM ammonium acetate buffer B: acetonitrile. Timetable (mins, %B) (0,5), (21,55), (24,95), (25,5)
Column bleed – despite the best efforts from column manufacturers, sometimes the bonded stationary phase or end capping reagents can leach from the surface and ultimately end up in the column and subject to the same gradient focussing mechanisms as other contaminants (Figure 8). Whilst most columns are reasonably stable under proper operating conditions, phenyl and fluorinated phases tend to suffer from higher bleed. Follow manufacturers’ recommendations for column use and storage.
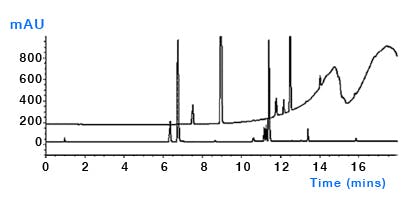
Figure 8: After standing for several hours the first injection of a sequence using a perfluorinated column (upper trace) and a C18 column (lower trace). Subsequent injections of the perfluorinated column showed less bleed. Columns: 150mm×4.6mm, 3μm, temp.40oC, 1.5mL/min, λ=254nm. EluentA: water plus 0.1% formic acid; eluentB: methanol plus 0.1% formic acid. Timetable(mins,%B):(0,10),(15,95),(18,95),(18.1,10),(23,10). (Reproduced from reference 1)
I hope the information presented here has highlighted the need to consider contamination from a variety of sources which ultimately may contribute to discrete ghost peaks in a gradient chromatogram. I can’t stress highly enough the value of a blank (zero injection volume if possible) chromatogram to study the source and contribution of eluent and system contaminants to your chromatographic output, especially when working at lower or trace detection levels.
Consumables quick lists for Agilent 1290 Infinity uHPLC systems »
More information on syringe filters for sample filtration »
References
S. Williams, J. Chromatogr. A. 1052, 1–11 (2004).
Mark R. Taylor, Fiona Harvey-Doyle, Krina Patel, LCGC Asia Pacific, Nov 01, 2015, Volume 18, Issue 4, pg 6–17
V.Lopez-Avila, J.Milanes, F.Constantine, W.F.Beckert, J.Assoc.Off.Anal.Chem. 73 (1990) 709.
M.D.Nelson, J.W.Dolan, LC–GC 16 (1998) 992,994.
A.Otsuki, J.Chromatogr. 133 (1977) 402.
D.W.Bristol, J.Chromatogr. 188 (1980) 193.
S.M.McCown, D.Southern, B.E.Morrison, J.Chromatogr. 352 (1986) 493
Related articles