31 Oct 2017
Data Systems - Do You Know Where Your Results Come From?
I’m sure most of us will be aware of the Able Labs fraud of the early 2000s in which chromatographic data was manipulated to ensure that failing batches of generics drugs were in fact passed as fit for purpose (1,2). This fraud involved manipulation of chromatographic baselines, as well as adjustments of weights, purity factors, and calculations to ensure acceptable results.
Hold that thought.
Can’t do it? Don’t know where to start? Can’t be expected to do that as the computer works out linear regression equations from the calibration curve which can't be easily reproduced? Not necessary as the data system and the method have been validated? That’s what you have a data system for, and as long as input data has been properly checked then there is no need for this depth of scrutiny?
I wonder.
Am I accusing anyone of fraud? Absolutely not. The vast majority of analytical scientists I know are beyond reproach regarding the quality of their work and have unimpeachable ethics.
But what about negligence? Again, I’m not calling into account your ethics, but I do know that filling in the cells of the method sequence with the data from our notebooks, ensuring system suitability and QC checks "pass" according to the specification, checking validity of integration and then recording the results in our notebook or laboratory data system is about as far as many of us go with respect to data diligence. I’m simply questioning if this enough to ensure that the result calculated by the data system is correct (to within experimental error)? In many cases the answer is yes, the methods are indeed validated, and then in some cases "locked" from spurious or inadvertent changes.
However, I want to highlight the notion that the validity of the method of result calculation in the data system isn’t "someone else’s responsibility." In fact, by knowing something of the actual mechanics and mathematics of the production of the final result, we can much more effectively troubleshoot issues which may arise with the data being produced.
Here is a typical example of an analytical determination and how it might be handled by a data system including some the of the more esoteric aspects of the calculation which may remain "hidden" to most operators but can be the cause of insidious error when mistakes or misjudgements are made.
A determination of substance X in matrix Y is evaluated using a multi-point calibration curve as the analyte amount is known to vary widely with time.
The determination uses duplicate injections of standards at each of 5 levels (no blank or zero concentration calibrant is used). I’ve skipped a lot of the finer experimental detail in the interest of brevity.
The calibration yields a line of best fit equation of the form:
y=100.92x + 0.3562 (y=-mx+c)
If an average sample peak area of 327 units is obtained, the absolute amount of sample is calculated as follows (solve for x = interpolated amount):
327=100.92x + 0.3562

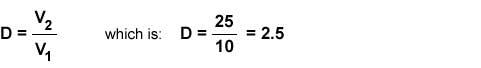
If the sample had been diluted from 10 mL to 25 mL during sample preparation then a dilution factor (D) should be used. This is calculated as follows:
If a standard purity of 98.6% had previously been determined, then a multiplier (M) would be required.
Amount (sample) = Interpolated Amount (x) x M x D
= 3.2367 x 2.5 x 1.014
= 8.2050 units
I’d ask you the following questions regarding the way in which your data system might handle this calculation.
How is the calibration curve constructed with respect to two individual injections of calibrant at each concentration level on the curve? Does the data system ‘average’ the peak areas and then plot a single point or does it plot two separate points at each concentration level?
How is the origin of the line of best fit handled? Does the data system force the line through the origin, does it include the origin as a point when calculating the line of best fit equation or does it ignore the origin?
Is there a weighting applied to the line of best fit such that lower concentration levels are given more prominence when calculating the y=mx + c equation? Is this a 1/x or 1/x2 weighting for example?
I’m asking you these things because unless you know the answers, you couldn’t reproduce the calibration function in Excel to check the validity of the equation for line of best fit that is produced.
Further, some data systems may also yield analysis of the residuals associated with each point on the calibration curve to test for bias or non-linearity alongside the regression co-efficient (r2) value.
Further questions about the result calculation may include;
The dilution factor of 2.5; is this a number which is simply inserted into the method somewhere without you really knowing what it pertains to? Could it be inadvertently changed without you noticing or is it ‘locked’ into the method? Do you know the derivation of these ‘factors’ which are part of the data system calculation and could you reproduce that factor manually?
Similarly, the purity factor of the reference material used to build the calibration function; is this changed with each new batch of reference standard that is used in this test? Are you aware of where it is entered into the data system and would you know what value was used when your sample ‘result’ is printed? Who checks that this number is correct?
Finally (and I’ve only covered the bare minimum of possible sources of variation here), when the ‘result’ is calculated, are the peak areas for the duplicate samples averaged and a single value interpolated from the calibration line of best fit or are two separate results calculated and the average subsequently calculated?
Again, without knowing much of what is written above, it would be impossible to manually calculate the result to assess the validity of the data system result?
I write these questions not to alarm or annoy you, merely to point out the number of ‘decisions’ that need to made when establishing a method for calculating a result and the number of things which can go wrong when setting up the method, transferring it between systems or , frankly, due to ‘finger’ trouble’ of various instrument operators.
Please don’t adopt the attitude that methods are for ‘senior analytical people and lab managers’ – if you use the method you should own the validity of your data. I would strongly urge you to try, at least once, to reproduce your data system result using Microsoft Excel – it really will be a very interesting exercise in learning about how data is derived and you will be much better placed to troubleshoot the data on an ongoing basis.
I realise that this entry may sound rather ‘preachy’, but data validity and a thorough understanding of the results that we produce should be of great interest to us all.
1. Able Laboratories FDA Form 483 Observations, July 2005.
2. Able Laboratories staff criminal prosecution for fraud: http://www.fda.gov/ICECI/CriminalInvestigations/ucm258236.htm
Related articles