27 Aug 2020
GC-MS Tune Report
Your GC-MS tune report is much more than a case of pass or fail
It allows you to examine the shape your mass spectrometer is in. Under some conditions, it’s even possible for the instrument to tell you it has passed when it hasn’t!
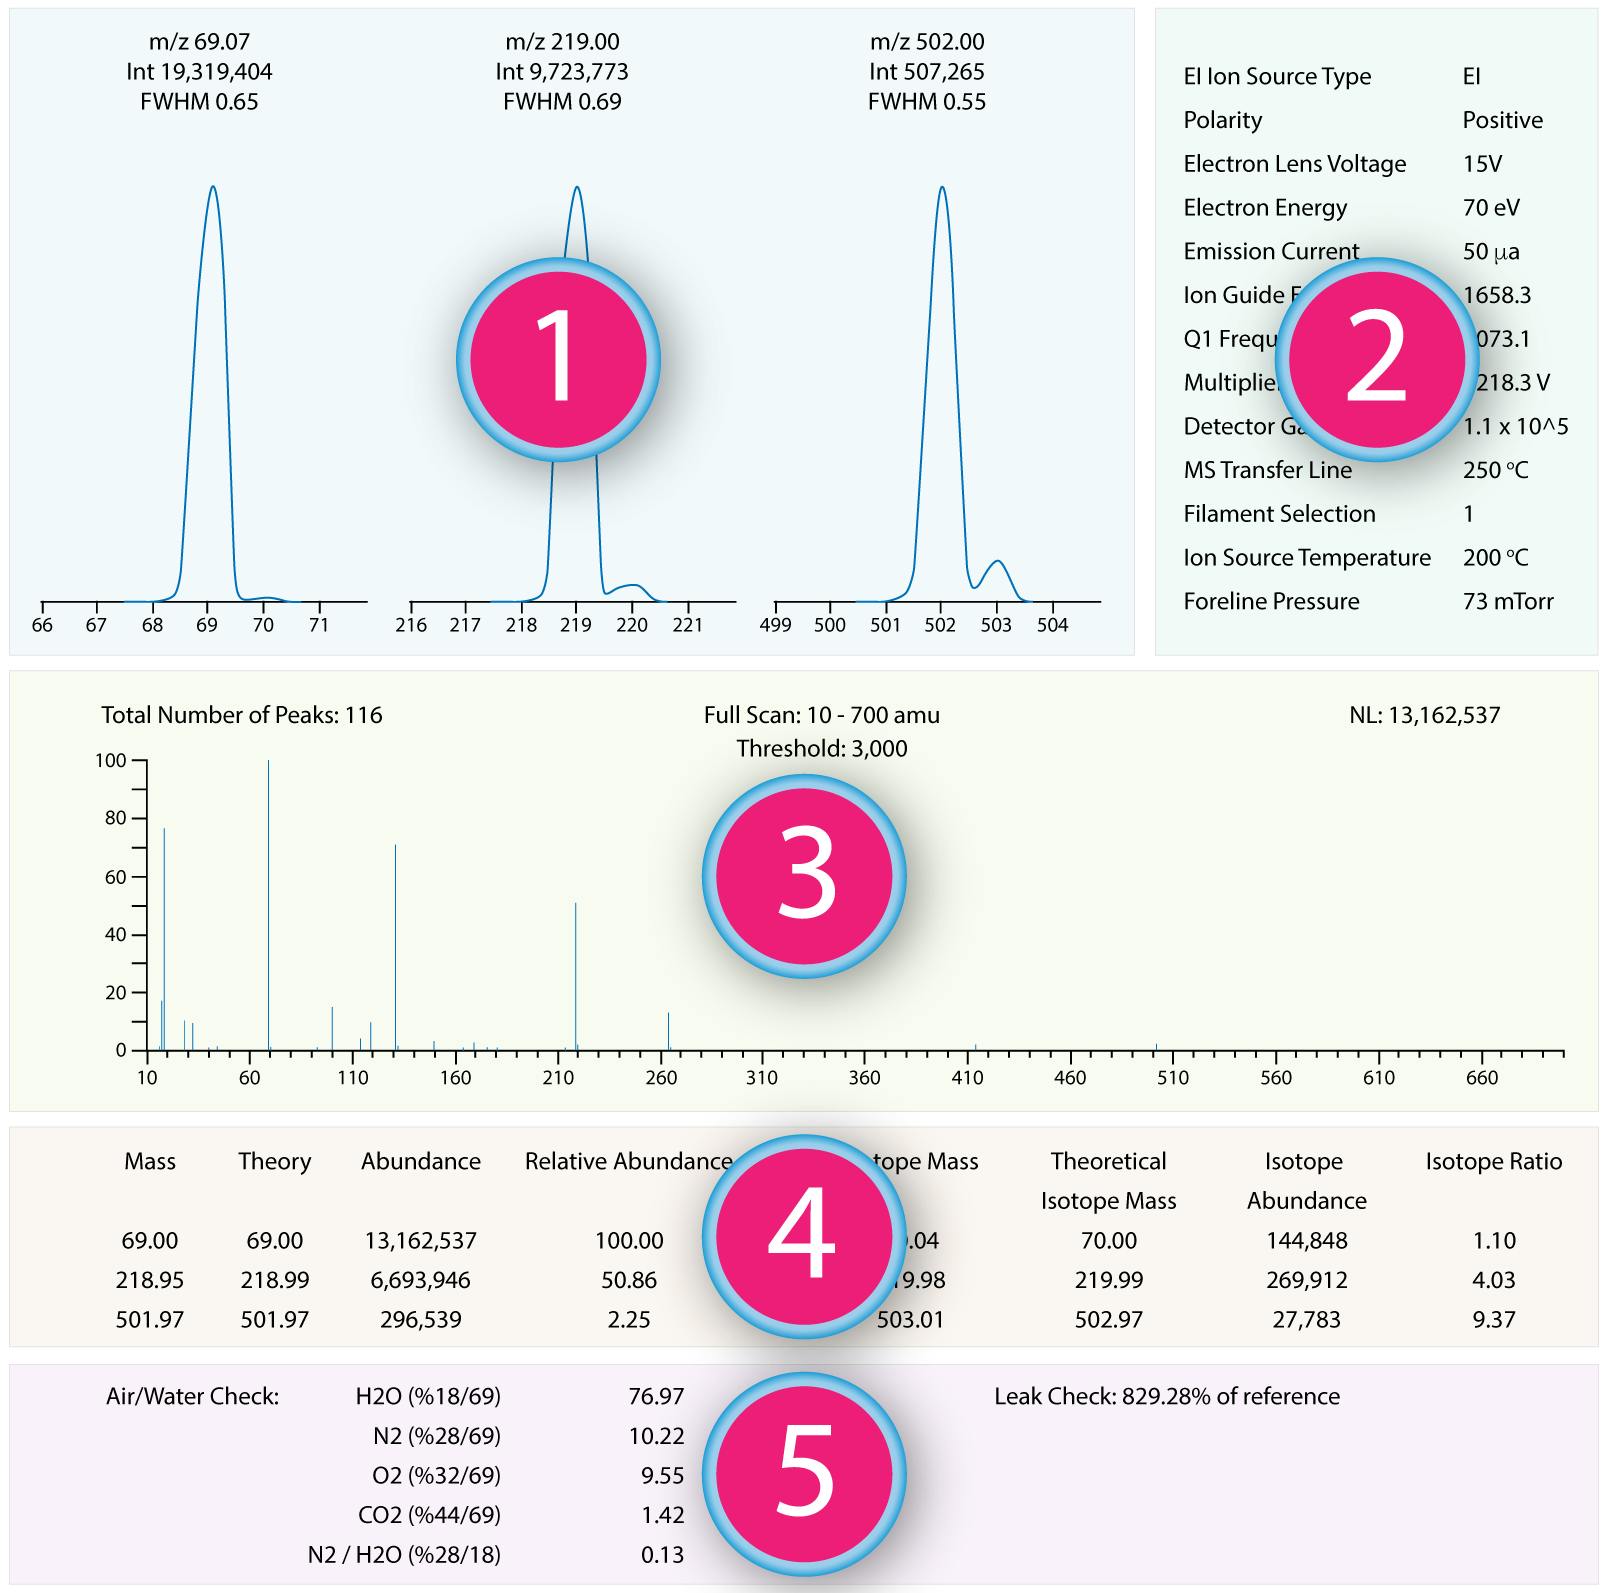
This is a quick break down of the 5 sections in a tune report and what to look for.
Section 1
What It Tells You
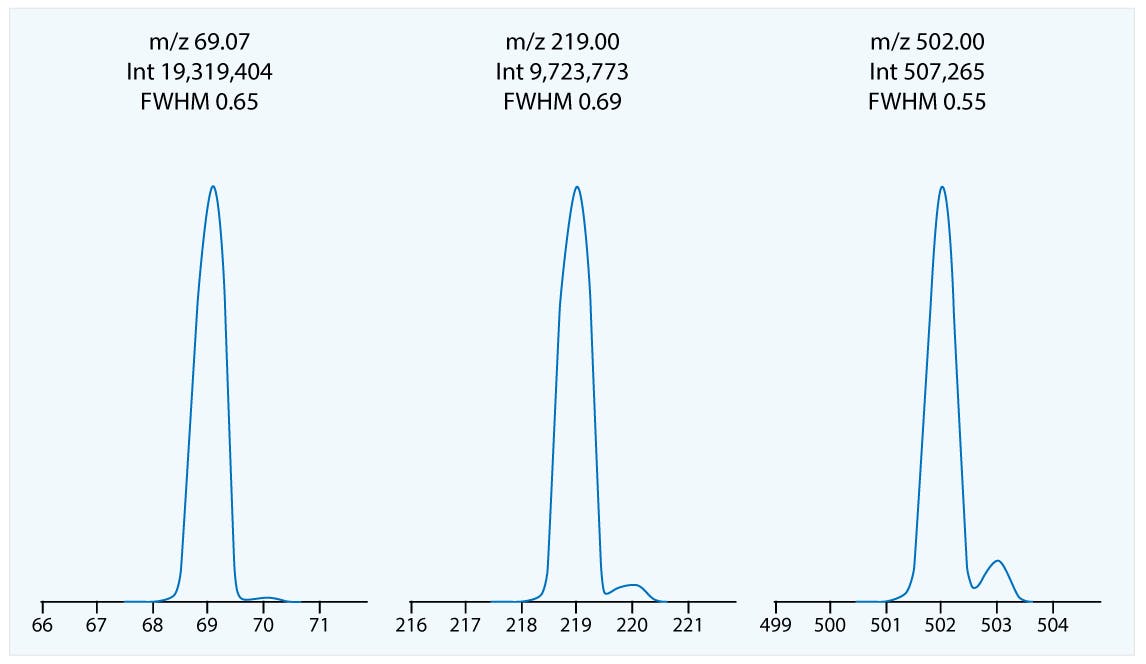
Shows you the signal for the three main ions from PFTBA that the instrument tunes on.
Things to Look For
- Check the instrument has picked the three corrections. It’s normally 69, 219 and 502
- Check the signal intensity for each mass is in keeping with what you’d expect. These values will differ from the signals presented later in the report as the information is acquired at different times.
- Confirm the shape of the peak is Gaussian and symmetrical
- Check for excessive levels of baseline noise
- Check for any additional extraneous masses in the region.
Section 2
What It Tells You
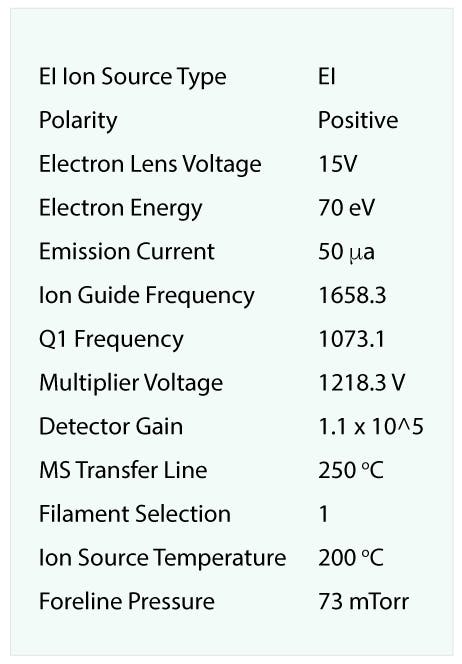
Tells you which settings the instrument is using to obtain the data presented.
Things to Look For
- Some values will stay very similar in every report, some will vary considerably with every tune. Review several reports and get a feel for what ‘normal’ values your instrument typically delivers
- Carefully check the multiplier voltage. Over time this will drift upwards as the multiplier wears. Your instrument manual or service engineer will advise when the multiplier requires replacement. Do not manually adjust the multiplier voltage.
Section 3

What It Tells You
Shows you the full scan spectrum for your tune
Things to Look For
- Visually check that the complete tune file looks correct
- Check that each target mass (69, 219 and 502) has been selected correctly by the instrument for tuning
- Check the entire spectrum for unusual signals i.e. contamination. This is one indication that the source requires cleaning.
- Carefully check the region around each target mass for any contaminating ions. The instrument could misselect a contamination ion and tune on this substance rather than the PFTBA ion.
- Verify there is not excessive baseline noise
- Check the signal between 17 – 45 — this is the region where ions generated by leaks are found
Section 4

What It Tells You
Gives the data acquired from the full scan of the PFTBA tune
Things to Look For
- Verify the three masses (69, 219 and 502) are correct and within normal tolerances typical of previous reports
- Verify the absolute abundance (signal) values for each mass are typical. These give an indication of the level of sensitivity. The instrument will generally aim to obtain these values but may generate a noisy chromatogram.
- Verify the relative abundances are typical. These differ significantly between instrument types but are critical in allowing the instrument to obtain representative spectra suitable for library matching
- Ensure these C13 isotope masses are +1 on the target masses.
- Isotope ratios. Check they are typical – they would normally be around 1, 4 and 9. These give an indication of the number of carbons present in the target mass. If the instrument has tuned on a contaminant mass, there is a good chance the isotope ratio will differ due to the contamination containing a different number of carbons to the required mass.
Section 5

What It Tells You
The signals attributable to H2O, N2, O2 and CO2 – the substances introduced by an air leak. These are normally expressed as a ratio relative to another constant ion (e.g. 69), but this differs between instruments.
Things to Look For
- Verify that signals for these ions are below the acceptance level. Any higher and you may have a leak – usually as a result of the high vacuum pulling in air. It is common for this signal to be high if the system has been recently vented
- A common source for a leak is the ferrule connecting the column to the transfer line. This should contain vespel, but occasionally needs tightened.
- A high signal at 18, without the associated gas ions at 28, 32 and 44 tends to indicate contamination – either directly from water present within the GC-MS system (e.g. after cleaning), an exhausted water filter on the carrier gas line or a water fragment formed from a higher mass compound.
-
And that is how you use a tune report to ascertain the quality of your mass spectrometer. Going through these steps for each tune report will ensure that your analysis is more reliable and require less troubleshooting down the line.

