24 Jun 2026
Crawford Scientific
Our knowledge. Your advantage.
Crawford Scientific Chromatography Articles
Latest Blog

17 Jul 2026
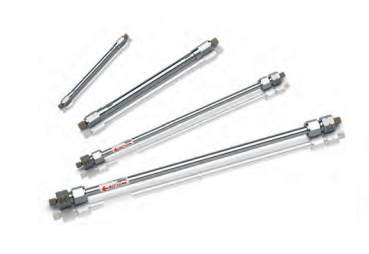
Chiral HPLC Columns at Crawford Scientific: A Guide to Our Supplier Portfolio
...
-
 Read more
 -

16 Jun 2026
Read moreAdvion-Interchim Scientific Flash Chromatography Systems: Scientific Performance Across the Entire Purification Workflow
-

08 Jun 2026
Read moreGLP-1 Drug Development: Analytical Methods, Impurity Analysis, and Purification Techniques
-

01 Jun 2026
Read moreemp BIOTECH Purification Products and Resins for Biomolecule Purification
-

19 May 2026
Read moreHelium Shortage 5.0 - a true operational concern for gas chromatography laboratories
-

31 Mar 2026
Read moreMacroSep IEX Q Resin: Advancing the Purification of Large Biomolecules
-

09 Mar 2026
Read moreAgilent Altura Poroshell 120 PFAS Column With Ultra Inert Technology
-

14 Jan 2026
Read moreHALO® OLIGO C18 Columns: Advanced Separation for Oligonucleotide Analysis
-

11 Dec 2025
Read moreUnlocking Higher Data Quality with the Agilent J&W DB-5Q GC Column
-

19 Nov 2025
Read moreGL Sciences MonoSpin: Monolithic Silica Spin Columns Optimised for Centrifugal SPE
-

13 Nov 2025
Read moreHALO® PFAS Solutions – Expanded Column Range for Analysing Persistent Contaminants
-

22 Oct 2025
Read moreExpanding Bio-Chromatography Capabilities with YMC’s Comprehensive Glass Column Range