16 Jun 2026
Crawford Scientific
Our knowledge. Your advantage.
Crawford Scientific Chromatography Articles
Latest Blog
24 Jun 2026
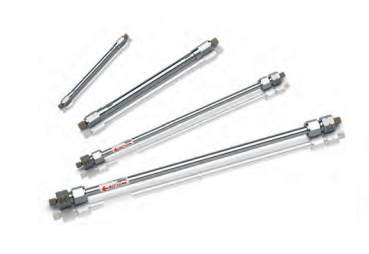
TSKgel Columns for Polymer Analysis: Optimised SEC/GPC Solutions for Polymer Characterisation
Accurate polymer characterisation begins with selecting the right SEC/GPC column for your application. With a wide variety of polymer types, solvent systems, and analytical conditions to consider, column selection is an important step in developing reliable and reproducible methods.
TSKgel columns from Tosoh Bioscience are designed to support this process, offering a comprehensive portfolio...
-
 Read more
 -

08 Jun 2026
Read moreGLP-1 Drug Development: Analytical Methods, Impurity Analysis, and Purification Techniques
-

01 Jun 2026
Read moreemp BIOTECH Purification Products and Resins for Biomolecule Purification
-

19 May 2026
Read moreHelium Shortage 5.0 - a true operational concern for gas chromatography laboratories
-

31 Mar 2026
Read moreMacroSep IEX Q Resin: Advancing the Purification of Large Biomolecules
-

09 Mar 2026
Read moreAgilent Altura Poroshell 120 PFAS Column With Ultra Inert Technology
-

14 Jan 2026
Read moreHALO® OLIGO C18 Columns: Advanced Separation for Oligonucleotide Analysis
-

11 Dec 2025
Read moreUnlocking Higher Data Quality with the Agilent J&W DB-5Q GC Column
-

19 Nov 2025
Read moreGL Sciences MonoSpin: Monolithic Silica Spin Columns Optimised for Centrifugal SPE
-

13 Nov 2025
Read moreHALO® PFAS Solutions – Expanded Column Range for Analysing Persistent Contaminants
-

22 Oct 2025
Read moreExpanding Bio-Chromatography Capabilities with YMC’s Comprehensive Glass Column Range
-

17 Oct 2025
Read moreThe HALO® Selectivity Landscape