20 Sep 2017
HPLC column overload
Much has been written about column overload, however, I've seen many instances lately in which overload may not be instantly recognized, or causes problems that may not normally be attributed to overload. Therefore, I wanted to explain how to spot and deal with different types of overload situations.
Gross overload tends to lead to peaks which either front or tail badly and whose retention times may vary from the non-overloaded separation. However, more subtle overload effects are more insidious and can be seen in everyday chromatography as shown in Figure 1.
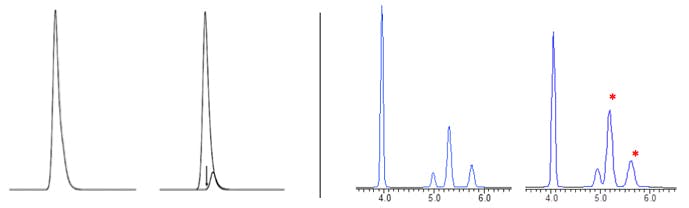
Figure 1
(Left): Tailing peak due to overload conditions (left) or an unresolved impurity (right)?
The distinction between the two may require a different set of conditions or a spectral detector [1]
(Right): Reversed phase separation in which loading is doubled from 10µg to 20µg which effects
resolution and ease of integration for the two peaks at around 5mins. (note * denotes ionisable compounds)
There are two different types of overload –
- Mass Overload in which too much analyte is injected onto the column
- Volume Overload in which too much liquid is injected onto the colum
The physical symptoms of each of these overload situations are different.
In Mass (sometimes also called Concentration) Overload the analyte molecules 'saturate' the silica at the inlet end of the column which causes the excess molecules to flood forward down the column, which shifts the centre of mass of the analyte band down the column, and results in a right sided 'shark fin' type peak and a dramatic reduction in the apex retention time as shown in figure 2.
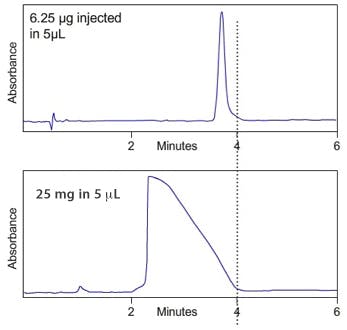
Figure 2:
(Top); Gross mass overload of a neutral analyte under reversed phase
conditions which shows a drastic reduction in retention time and a 'shark fin'
type peak [Figure courtesy of YMC Europe GmbH, Dinslaken, Germany]
It is generally accepted that for neutral compounds being separated using hydrophobic stationary phases in reversed phase HPLC, absolute sample loadings (i.e. amount of sample injected onto the column) of between 1 and 10mg should be possible. Table 1 below shows the maximum theoretical load estimates for a range of popular column dimensions, based on the assumption that a 4.6mm i.d. column contains around 1g of silica packing material per 10cm of column length and a 2.1 mm i.d. column contains around 0.2g of silica per 10cm of column length
The mass loading estimates are a very crude approximation and empirical measurements should be made if mass overload is suspected. Generally one would reduce the mass injected by factors of 10 (or 2 for trace analysis) until the retention time and peak symmetry stabilize.
When moving from one column to another with different surface area and pore volumes, one can use the following approximation (eqn. 1) for the phase ratio of a packed bed (ratio of silica surface to eluent) to assess the loadability of the new column.
| Column Dimension (length x i.d. mm) |
Theoretical Loading Estimate (mg) |
|
150 x 4.6 |
15 |
Table 1: Loading estimates for some common column dimensions.
P = Asp/ (Vsp +Ei/(1-Ei)*(Vsp+1/ρ)) (eqn. 1)
Asp – surface area of packing (m2/g)
Vsp – specific pore volume (mL/g)
Ei – interstitial fraction (typically 0.4)
ρ - silica density (2.2 g/mL for fully porous silica)
So – if a loading for column 1 is found to be 25 µg, what will be the loading for column 2 as shown below
| Property | Column 1 | Column 2 |
| Asp – surface area of packing (m2/g) Vsp – specific pore volume (mL/g) |
380 1 |
180 0.4 |
Column 1
P = Asp/ (Vsp +Ei/(1-Ei)*(Vsp+1/ρ))
P = 380/ (1 +0.4/(1-0.4)*(1+1/2))
P = 380/ (1 +0.4/(1-0.4)*(1+1/2)) = 109
Column 2
P = Asp/ (Vsp +Ei/(1-Ei)*(Vsp+1/ρ))
P = 180/ (0.4 +0.4/(1-0.4)*(1+1/2))
P = 180/ (0.4 +0.4/(1-0.4)*(1+1/2)) = 112.5
Therefore – the loadability of column 2 is approximately the same as column 1 (25mg)
Everything we have considered to this point assumes that the analytes are in the neutral state. When dealing with ionized analytes, loading factors may reduce by a factor of between 10 and 50 times when using conventional reversed phase stationary phases.
This is demonstrated in figure 3, where Quetiapine, an ionized basic analyte under acidic conditions, shows gross overloading whereas the neutral analyte propiophenone, does not suffer from the same degree of overloading.
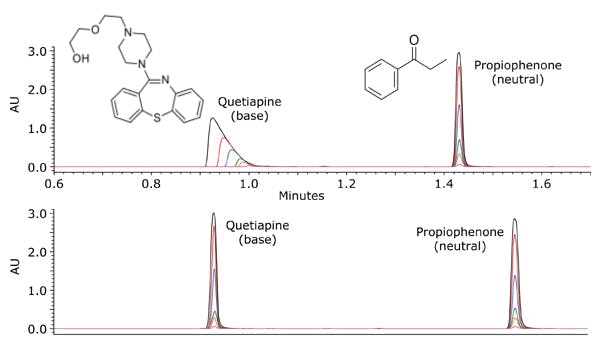
Figure 3; Loading capacity for quetiapine (base) and propiophenone (neutral) in acidic conditions (pH~2.7) on a
fully porous C18 column. Mobile phase A was 0.1% formic acid in water, and mobile phase B was 100% acetonitrile.
The gradient was from 5 to 95% B in 2.5 minutes. Flow rate was 0.6 mL/min. UV detection at 254 nm. Injection
volume was 5 μL. Column temperature was 30°C. Column dimensions were 2.1 x 50 mm, 1.7 μm. The mass load
on-column was between 10 ng (green chromatogram) and 1 μg (orange chromatogram) for each compound. [2]
The stationary phase surface becomes associated with charged analytes which are retained via hydrophobic interactions. The positive nature of the surface effectively 'repels' the positive charge of analytes in the eluent, and this phenomenon is particularly pronounced within the stationary phase pores, where analytes can be ion-excluded, thus effectively reducing the apparent column surface area.
There are a number of ways of dealing with this issue, including the obvious approach of adjusting the eluent pH to ensure the analyte is in the ion-supressed form. However modern HPLC columns are available with mixed mode stationary phases, which contain electrostatic groups of opposite charge to the analyte, which help to reduce the electrostatic repulsion effects described above.
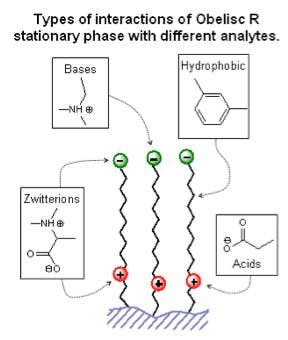
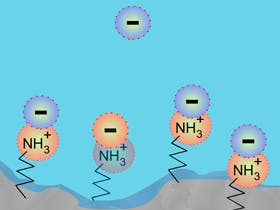
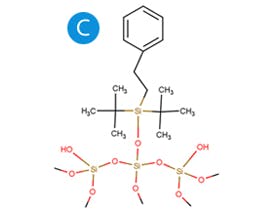
Figure 4; Example of a zwitterionic mixed mode stationary phase which can interact
both hydrophobically and electrostatically, which helps to reduce ion-exclusion and
improve loadability of ionized compounds [Figure courtesy of SIELC Technologies,
Prospect Heights, IL, USA]
Figure 5 shows a loading study with dopamine on a reversed phase C18 column which is marketed as providing good retention of polar compounds and a zwitterionic mixed mode phase. Note that the retention time and peak shape on the mixed mode phase are affected to a much lesser degree than the standard stationary phase
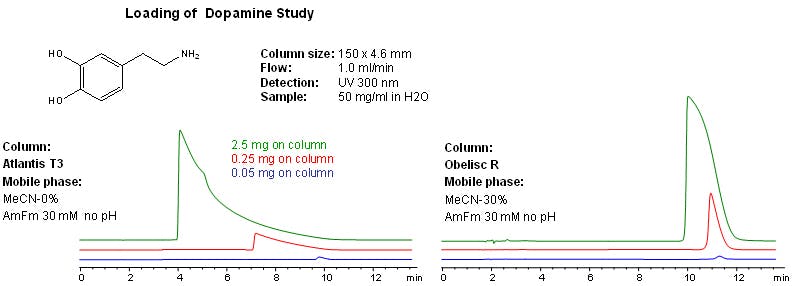
Figure 5: Ionised analyte loading study using a mixed mode and non-mixed stationary phase [Figure courtesy of SIELC Technologies, Prospect Heights, IL, USA]
Volume overload occurs when the injected sample volume is large enough to carry analyte molecules through a significant proportion of the interstitial volume within the column and leads to shark fin type peaks and later elution times as shown in Figure 6.
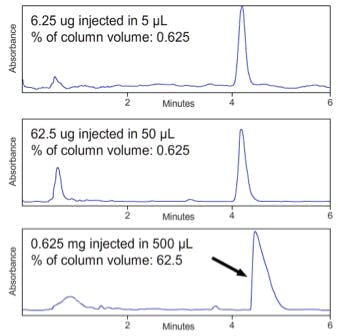
Figure 6; Volume overload at constant sample concentration on a C18
reversed phase HPLC column (150 x 4.6mm, 5µm) [Figure courtesy
of YMC Europe GmbH, Dinslaken, Germany]
Volume overload can be avoided if the injection volume is kept below 15% of the peak volume. We can ESTIMATE this for a range of columns of various dimensions given some theoretical efficiency (plate) values.
| Column Dimension (length x i.d. µm x dp) | Theoretical Plate Number (N) |
| 150 x 4.6 x 5µm 100 x 4.6 x 5µm 50 x 4.5 x 5µm 100 x 2.1 x 3µm 50 x 2.1 x 3µm 30 x 2.1 x 3µm |
10,000 7,500 5,000 10,000 5,000 3,000 |
Table 2: Target efficiencies for some common HPLC dimensions
N = 16 (tr/wb)2 (eqn. 2)
Equation 2 can be re-arranged to allow an estimation of the peak width (volume);
wb = tr / √(N/16)
So, for a peak eluting at 2.5 minutes on a 50 x 2.1mm column;
wb = 2.5 / √(5000/16)
wb = 0.14 mins.
If the column flow rate is 0.5mL/min then the peak volume will be
0.14 x 0.5 = 0.070mL
and 15% of this volume is;
0.070 x 0.15 = 0.011 mL = 11µL
Finally, the strength of injection solvent used to dissolve the sample can have a pronounced effect on the loadability of analytes.
Analytes injected in an eluotropically 'strong solvent' (i.e. high % organic) are likely to show overload phenomenon at much lower concentrations than those dissolved in the mobile phase or a diluent which is eluotropically weaker than the mobile phase. This is primarily due to the behaviour of the analytes which remain dissolved in the mobile phase as they enter the column. By limiting injection size and adjusting the strength of the sample diluent, these effects can be mitigates as shown in Figure 7 and Table 3. For a more complete treatment of this subject follow this link: Analytes injected in an eluotropically 'strong solvent' (i.e. high % organic) are likely to show overload phenomenon at much lower concentrations than those dissolved in the mobile phase or a diluent which is eluotropically weaker than the mobile phase. This is primarily due to the behaviour of the analytes which remain dissolved in the mobile phase as they enter the column. By limiting injection size and adjusting the strength of the sample diluent, these effects can be mitigates as shown in Figure 7 and Table 3. For a more complete treatment of this subject follow this link: technical/chromatography-technical-tips/hplc-chromatography-blog/sample-diluent-effects-in-hplc
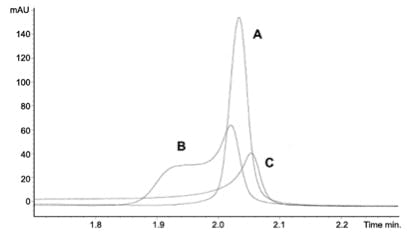
Figure 7: Peak shape effects on a caffeine sample dissolved in (A) 33% acetonitrile
(B) 66% acetonitrile and (C) 100% acetonitrile. Caffeine at 0.75 mg ml−1, 4 μl injection volume.
Column: Luna 3 μm C18(2) 50×2.0 mm. Mobile phase: gradient 5 to 95% acetonitrile
(with 0.1% formic acid) in 7.5 min at a flow-rate of 1 ml min−1. (Adapted from Reference 3)
| Sample Solvent Strength | Maximum Injection Volume |
| 100% Strong Solvent Stronger than mobile Phase Mobile Phase Weaker than Mobile Phase |
≤ 10 µL ≤ 25 µL ≤ 15% of Peak Volume Large |
Table 3: Recommended maximum injection volume for a range of sample diluent types in order to avoid overloading and peak shape deformation phenomena
- Jun 1, 2005 LCGC Asia Pacific Volume 8, Issue 2
- Iraneta PC, Wyndham KD, McCabe DR, Walter TH. A review of Waters hybrid particle technology. Part 3. Charged surface hybrid (CSH) technology and its use in liquid chromatography. Waters white paper 720003469EN. 2010 June
- T.-L. Ng and S. Ng, J. Chromatogr. A 329, 13–24 (1985).
Related articles