09 Nov 2020
Peak Purity Analysis

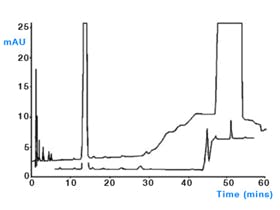
How many compounds do you see in this UV chromatogram? Just one? What if we look at the mass spectrum for that peak?

Pure? Impure?
When we want to identify or quantify a peak we need to be have confidence in the fact that the area/height we are measuring is from just a single compound and peak purity analysis is a tool to assess this. It is important to remember before we start that we can only prove that a peak is impure because:
- The impurity could be a lot lower in concentration and therefore it is difficult to say statistically.
- How pure do we want to say a peak is and what is the cut-off we set? How do we decide what is a peak and what isn’t a peak?
- The spectrum profiles could be very similar if not the same
- For 2 compounds that elute at almost the same time, it is not unreasonable to expect that they have similar absorbance spectra or produce the same ions in a mass spectrum. Even with ISCID or MSMS, isomers will form very similar fragments and it usually the abundance which gives them away so peak purity analysis will struggle to distinguish between them.
- The impurity co-elutes completely with the target.
- When we look at the distribution of intensities over time, as we do in peak purity analysis, we are looking for differences in peak width, apex time and if 2 peaks truly co-elute. True co-elution means that this process is not able to distinguish them. Orthogonal chromatography such as HILIC to RP or vice versa may have a chance of resolving the peaks.
- The detector isn’t sensitive to the impurity.
- UV detectors are able to detect compounds with chromophores but that does not mean that they will ionise and be observable to the mass spec and vice versa. Complimentary techniques can help ensure as many compounds are picked up as possible
So therefore we can improve our confidence in our peak purity analysis by increasing the differences in the target and impurity in the spectrum by concentration, modification or chromatographically.
We say this in EVER SINGLE COURSE WE DO, garbage in – garbage out. Get yourself a good method and everything is easier! Get proper K’ and you wont have early eluting peaks overlapping with non-retaining impurities or bleed effecting the high retaining compounds. There are some method parameters we should consider before we look at the software’s ability to determine peak impurity.
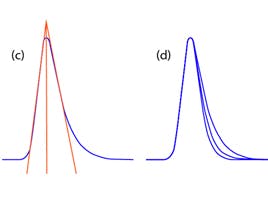
Sample rate – how often the detector takes a measurement will affect the quality of your peak. Too slow and you don’t have enough points across it to get a proper idea of the start, end, apex, shape of the peak whilst if you are too fast you will lose sensitivity and increase noise. CDS programs can allow you to enter your narrowest peak width and it will calculate a suitable acquisition rate but it can be done manually by measuring the peak width in minutes and dividing by the number of scans you wish to have.

Figure 1 - effect of scan speed on peak shape.
Bandwidth – when selecting a wavelength, you also select a bandwidth and this means you are actually collecting a range of bandwidths (e.g. selecting 280nm with 4nm bandwidth will mean the detector is collecting 278-282nm). Increasing the bandwidth will improve your S/N as you are increasing the wavelength range you are looking over which will smooth out noise. Decreasing bandwidth will improve selectivity but noise will increase as we are averaging less wavelengths so the noise isn’t cancelled out. In terms of peak purity we have a decision to make, we can be very specific in our wavelength and any co-eluting peaks with nearby maxima will not be picked up and the peak area will be exclusively from the target but if you are looking for impurities, maybe a larger bandwidth will pick them up. Now absorbance spectra are not analogue, on or off, they go up and down so we are likely to get overlap even if lambda max’s are different.

Figure 2 - effect of bandwidth on chromatogram.
Slit width – The total amount of light that is let through from the flow cell onto the grating and then the photodiode. Larger slit widths mean more light is allowed through and therefore we increase sensitivity but there is a bleed effect between the wavelengths as they can enter from a variety of angles and be focussed onto the PDA and we lose spectral resolution. Peak purity analysis is about looking at absorbance differences across a peak and these can be small so we need good resolution between the wavelengths otherwise the information is “smoothed” out.

Figure 3 - Effect of slit width on spectral resolution.
A basic approach to peak purity is that we can visualize with normalized peaks and or ratiograms:

Normalised peaks give us a change to “eye-ball” the elution profile of the two signals and a ratiogram allows us to do this with unnormalized peaks.
Whichever CDS you use it is capable of giving a peak purity score which is based around covariance which is a measure of how much the two variables change together:

Figure 4 - Correlation Coefficent.
To ensure the correct assessment of the peak purity there are several steps that need to be taken to obtain a good quality spectrum for analysis.
Background Correction
We want the comparison to be between the target and a possible impurity and therefore we need to remove any other factors. Mobile phase change during a gradient or impurities from the matrix need to be removed by doing a background correction.
These peaks are present before and/or after the peak so we can take spectra from these times and remove them and the CDS allows us choose how we do the correction.
- No reference – no correction is made and is not recommended unless you want the true raw data. We are manipulating data and it can go wrong (360nm ref for a DAD)
- Manual Reference – The user can specific up to two reference points themselves for peaks that are not resolved.
- When one reference spectrum is selected, the selected spectrum at the specified time is taken from the data file and subtracted from each peak spectrum. This correction cannot be used for a changing background absorption.
- When two baseline spectra are selected, a linear interpolation is made between the two spectra. A reconstructed reference spectrum based on the linear interpolation is subtracted from each peak spectrum. This correction can be used to compensate for a slow changing background absorption.
- Automatic background selection – dependant on the data acquisition settings but the software will choose appropriate points before and/or after the peak to subtract from the acquired spectrum during the peak.
Wavelength / Mass Range
This range should be set that it is only looking at wavelengths that are significant to the analysis. At the lower end we will suffer high noise due to a lot of components of an LC absorbing at that region or small molecular interference. At the higher end we will be analysing wavelengths or masses that have no benefit but will increase random noise variations and increase calculation times.
Spectral Normalisation
Normalization compensates for the changing concentration of the component passing through the detector cell as the peak eluted. The spectra are normalized and overlaid for graphical presentation. It can do the normalisation either by maximising absorbance, the area of the spectrum or the best possible match.
Absorbance Threshold
This is another way of limiting the number of comparison points the calculation uses and keeps the lower part of the peaks out of the way which will mainly contribute to noise rather than signal. Too low a threshold and you can get false fails, too high and you can get fails that are passes.
Following these steps will give us the most reliable evidence that a single peak contains a single compound and we can continue with a high degree of confidence with our work.
Related articles