02 Nov 2017
Troubleshooting HPLC Separation Issues - Are checklists only for pilots?
My colleague (himself an amateur pilot) asked this question recently and I wondered if there were any checklists that I use at work. I can’t say that I use many written lists, but it’s strange isn’t it that pilots place so much reliance on getting these technically difficult operations correct every time. Presumably because of the high level technical content and the fact that people’s lives depend upon it.
Setting up an HPLC analysis is also very technical and people’s lives may depend upon the result. So why aren’t we so diligent with our check lists? I guess our SOP’s are a form of checklist but I rarely see these being used in the same diligent manner as pilots kneeboard checklists. Actually most commercial pilots use iPad’s for their checklists these days and only by selecting a response for each line item do you get to continue to the next item to check. Perhaps this might point the way for possibilities in our world?
That aside, I did find that I have a whole bunch of checklists in my head. Obviously these have been somewhat ‘personalised’ and are in no way legislatively compliant – but they are terrifically useful. I also realised that the way we wrote the logic program for our online Troubleshooter at CHROMacademy (http://www.chromacademy.com/hplc_troubleshooting.html) was based on many ‘decision tree’ type checklist. I’ve been passed on so many of these troubleshooting lists over the years from learned colleagues and via publications – and this is as good a forum as any to share a very useful checklist related to HPLC troubleshooting.
HPLC Separation Problem Diagnosis
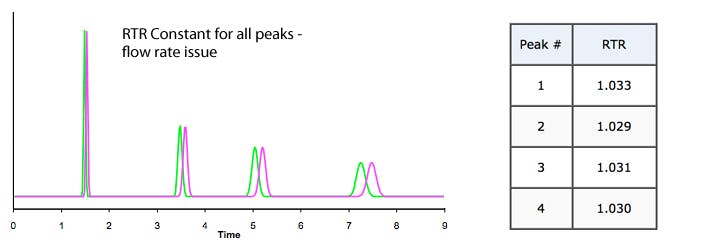
1. Measure retention time change ratio for all peaks of interest:
Retention Time Change Ratio (RTR) = Retention Time Original Chromatogram / Retention Time Problem Chromatogram
2. Is RTR constant for all peaks?
a) Yes – problem likely to be a flow rate issue
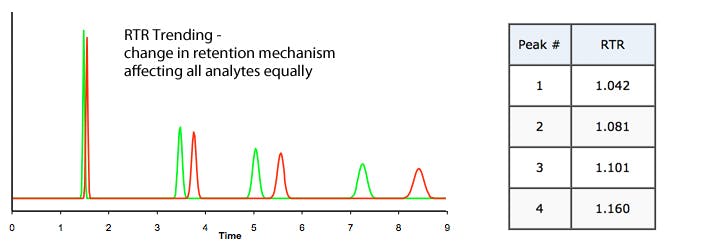
b) Trending (increasingly large or small RTR value) – problem may be related to %B or Temperature change;
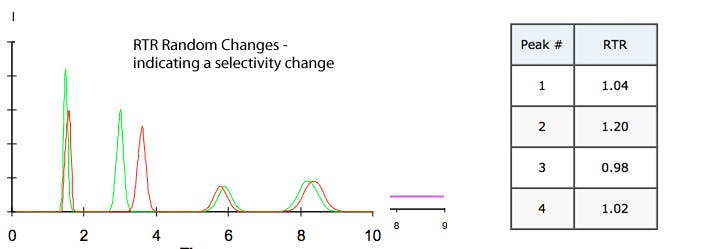
c) No Trend (Random changes in RTR value) – selectivity change indicating pH / solvent or stationary phase issues (changes)
An incredibly simple check list that most people will run in their minds whilst looking through troublesome data – even if the RTR values are not computed, but very powerful in helping to diagnose the cause of problems when retention times shift.
There are one or two other ‘checks’ that we can run to generate confirmatory data.
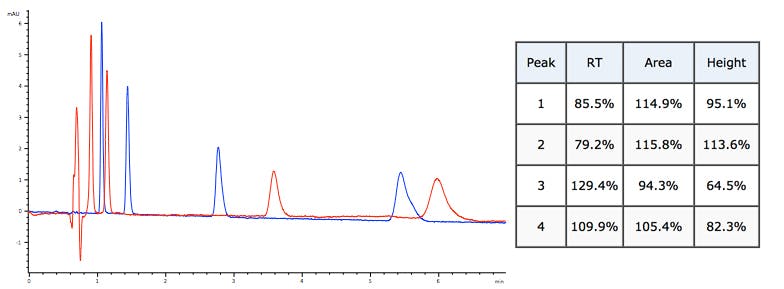
The solvent void disturbance can be used to check and confirm whether an eluotropic or flow rate effect is occurring as is shown is the following examples.
3. Does the void marker overlay or is it different?
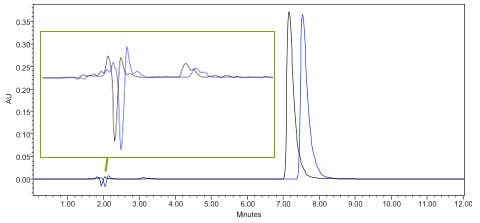
Example 1 – analyte retention time changes and void baseline disturbances also change – issue is probably with the flow rate / eluent delivery.
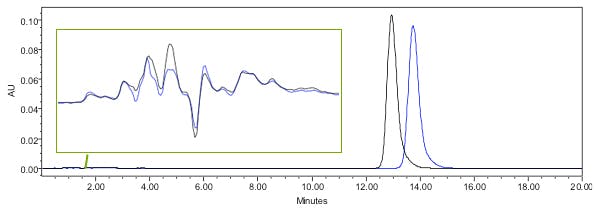
Example 2 – analyte retention time changes but void baseline disturbances overlay well – issue is probably with %B, Temperature or selectivity change.
We can also run some checks using the peak area ratio (PAR) and peak height ratio (PHR) of the peaks of interest within the original and problem chromatograms to further confirm our diagnosis.
4. How does the PAR change?
Peak Area Change Ratio (PAR) = Peak Area Original Chromatogram / Peak Area Problem Chromatogram
a) All ratios change in constant proportion – suspect a flow rate issue
b) No change – suspect a problem with %B or temperature
c) Random change – suspect a change in pH / eluent or stationary phase chemistry
5. How does the PHR change?
Peak Area Change Ratio (PAR) = Peak Height Original Chromatogram / Peak Height Problem Chromatogram
a) No change – suspect a flow rate issue
b) All ratios either increase or decrease but in an UNPREDICTABLE PATTERN – suspect a problem with %B or temperature
c) Random change – suspect a change in pH / eluent or stationary phase chemistry
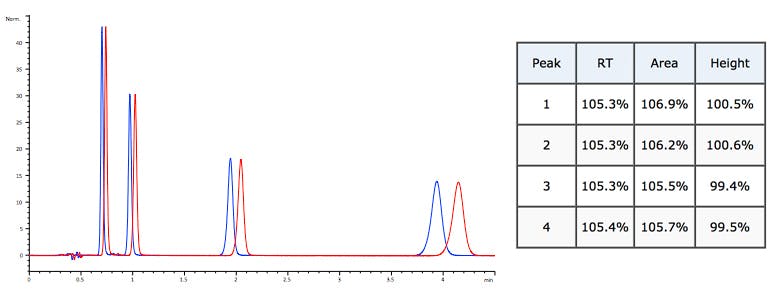
Flow rate reduced by 5%. Retention and peak area change – height remains constant.
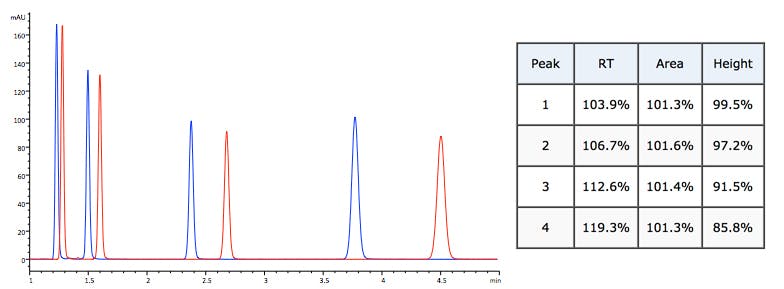
%B reduced by 3% Retention and peak height changes not consistent.
Mobile phase composition (selectivity) change Random changes to retention time, peak area and peak height.
To further explain some of these changes;
Why does area increase when flow decreases (for example)?
As flow rate slows the analyte moves through the flow cell more slowly, more data points are collected and the peak area increases.
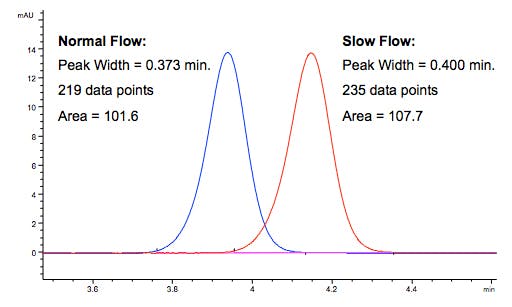
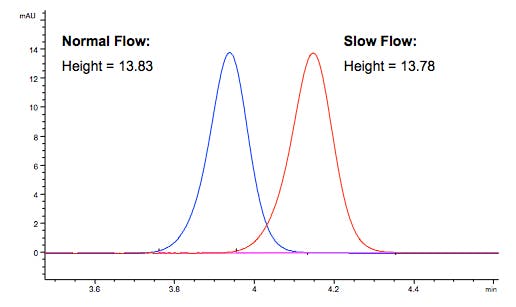
Why does the peak height not change when flow changes?
For a concentration sensitive detector (absorbance, fluorescence), the concentration of analyte in the detector does not change, so the peak height does not change.
Why does the height change when a composition change occurs?
When peaks elute from the column earlier they suffer less dispersion and therefore the band is more concentrated and the detector response higher.
When peaks elute later, more dispersion occurs, the analyte concentration decreases and the peak height decreases.
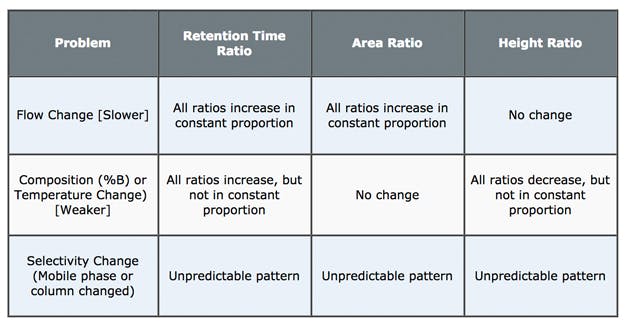
I’ve included a table below which summarises the check list inferences. I hope that this helps with your HPLC troubleshooting!
You can use the CHROMacademy HPLC troubleshooter at http://www.chromacademy.com/hplc_troubleshooting.html to further investigate HPLC issues.
My thanks go to Merlin Bicking (Accta, www.accta.com) for the beautiful illustrative examples which he supplied for this piece.
Related articles