28 Jul 2021
Single Point vs Multipoint Calibrations
By Colin Towers, Element Trainer
An analytical error can be significantly reduced by choosing the correct calibration type, especially when modifying or translating methods. Single-point calibrations are quick and easy. But they aren't always appropriate. So how do we decide?
Do I need to prepare and run multiple calibration standards, or can I use just one?
We love questions during our training sessions! Delegates either have specific goals in mind or have experienced certain difficulties. Their questions help us to understand the "why" behind our material. This was one such question at the start of a recent statistics course. A recap of the issue and explanation:
We have a method that we have been using regularly which utilizes a single point calibration and it meets all of its required criteria in terms of accuracy and precision. But we are now going to take it, modify it and use it for a different analysis. Can we just assume that the calibration is transferable?
Here is an example:
Our method has a single calibration point at 4 mg/ml which we prepare at the start of each analysis, and we run with a check standard which has been prepared by the QC department to ensure the accuracy of the method:

The calibration standard gives a response factor of 4.5 so the concentration of the check standard will be 17.8 / 4.5 = 3.96 mg/mL which is an accuracy of 98.89% and within the tolerance of the method.
The new method however requires us to run two check standards, one at a higher concentration and one at a lower concentration as the new samples are expected to be at a high and a low level. The QC lab prepares a sample at a concentration of 6mg/mL and we run that on our system and get the following results:

Our accuracy is out of specification, so what went wrong? Why was the method sufficient at one concentration but not the others? Here we are seeing the effects of incorrectly using a single-point calibration. To investigate, we return to the lab and perform a multipoint calibration across the desired range and plot the results:


Here we can see the advantages of plotting and visualizing our data. The multipoint calibration shows the true response of the detector to the sample concentration. It does not go through the origin point. Single point calibrations use the origin in order to obtain a straight line so we assume in these cases that a zero-concentration sample would give a response of zero. The original study was lucky that the chosen check standard concentration happened to be around the area where the two models have the least difference.
So how do we decide if a single-point calibration is suitable? We can use excel and a little stats knowledge!
Prepare and run several calibration standards across the desired measurement range and look for the regression tool in the Data Analysis Toolpack in excel:

Populate the wizard with the y and x values and output the data to a suitable location:

Excel will carry out the regression analysis and supply the following results:
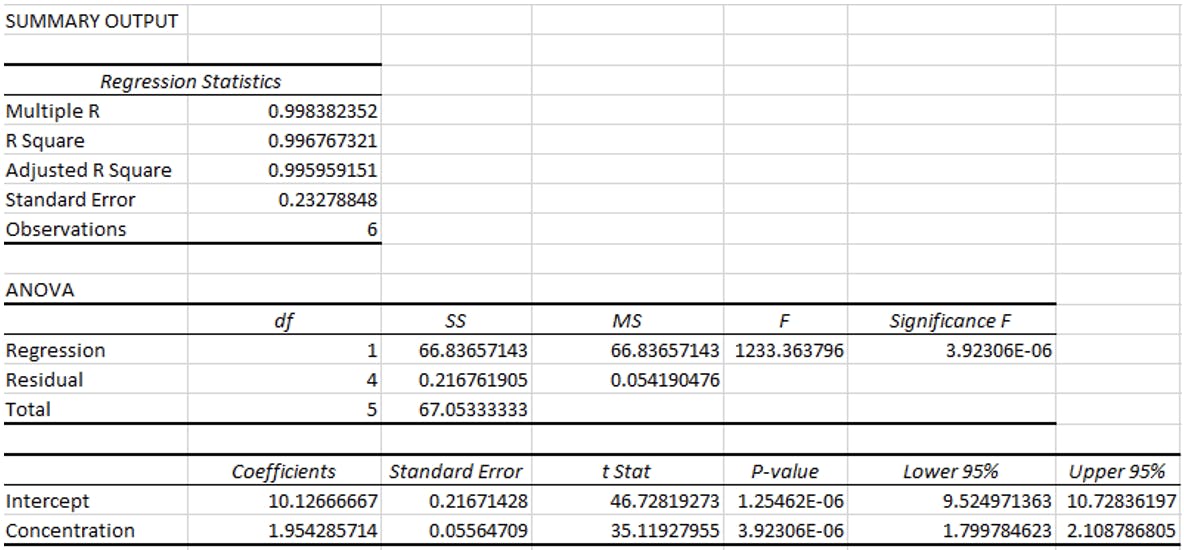
There is a lot of very useful information here which is covered in our Statistics for Analytical Chemists course and also in previous blog posts, but the part we are interested in is the intercept row.
Excel has calculated the line of best fit using the method of least squares and the intercept has been calculated as 10.12. Our question is “does this differ significantly from 0”? If it does, then a multipoint calibration is required. If it doesn’t significantly differ from zero then we can assume the origin as a calibration point which is required for single point calibrations.
Simply put we can see that the results show that with 95% confidence that the true value for the intercept is between 9.52 and 10.72 and zero is not within these values. This is the evidence we need to show that the origin should not be used in the calculation and that a multipoint calibration s required.
Here is another example of when a single-point calibration would be appropriate:
Various concentrations of tryptophan standard were measured in a UV-Vis spectrometer and the results are below:

Performing regression analysis on the results gave the following for the intercept:

Here we can see that zero fails within the 95% confidence limit values and we can therefore say there is no significant difference between the given value of 0.0039 and zero so a single point calibration is justified.
There are many more considerations when performing regression analysis than just looking at these values but it is a good starting point to understanding your calibrations and answer our first question: single point or multipoint?

